Wednesday 25 November 2009

Record debasement of British Pound! : 2009-11-25


Don't worry, these are not British pounds - we are not there (yet)!

Wednesday 25th November 2009 at 16:58.

So the record high in gold in pounds Sterling gives a new record low for the British pound in terms of gold. Let's see just how much our government and bankers have managed to debase the pound over the last century.

Easy to calculate. The present value of the £ compared to its value under the Gold Standard is the reciprocal of the current bullion price of a gold Sovereign coin which used to be a £1 coin worth £1!

Sovereign gold content = 0.2354 ounces
Present bullion value = 0.2354*706.73 (today's 'PM Fix' London gold price)
= £166.36 in today's 'money'.
It has been debased by a factor of 166 times.

Reciprocal of this (1/x function) = 0.006011 (oh dear).

Conclusion: The pound Sterling is now worth 0.6% of its original value under the gold standard when Sovereigns were issued annually for nearly 100 years between 1817-1914 for use as money before Britain left the Gold Standard.

It has lost 99.4% of its value since then; rather, 99.4% of its value has been taken away.

Let's calculate the new £ in terms of the old 'LSD' money (pounds, shillings and pence) where 20 shillings made £1 and 12 pence ('12d') made a shilling, ie 240d to the pound.

0.06011*240=1.44 d (old pence)

Interestingly, as an aside, in 1797 England issued 'Cartwheel Twopences' struck by the Matthew Boulton steam coin press (when Britain was the major industrial power in the world) and these weighed 2 ounces - almost like being on a gold/silver/copper trimetallic monetary standard, the price of copper being 1d per ounce.

In terms of this, today's pound sterling would be worth 1.44 ounces of copper when it used to be worth nearly 1/4 ounce of gold!

This fits neatly with the idea (the fact) that, when a government takes precious metals out of the coinage and replaces them with base metals, it allows them to debase the currency over time until the coins actually reach the intrinsic market value of the base metals they contain! The pound is now indeed a base metal coin, as are the dollar and the euro (and all the rest). Well, base metals dollars were produced in year 2000 and anyway, the alternative is a paper dollar, also very cheap to make. Eventually, a stage is reached when even the base metals in the coinage become more valuable than the face value of the coins for the lower value demoninations and have to be :

a) replaced by cheaper metals (copper pennies in Britain replaced by copper-plated steel in 1992 which is magnetic - you can separate these 1992-onwards minted coins using a magnet),
b) shrunk to fit the new shrunken metal value of the currency - (the cupro-nickel (formerly silver!) British coins were shrunk around the same time by about half, presumably for this reason), or
c) discontinued altogether (the smallest demonination English coins such as farthings and halfpennies were sequentially phased out, presumably because they couldn't buy anything or they were too costly to manufacture).

Eventually, under a paper money system, the monetary value of the paper note can be decreased until it is worth as much as the actual paper and ink plus perhaps the processing cost for manufacturing the actual note.

After that one is exhausted, you just add more zeros to the note, until you can hardly fit any more onto it.


Thanks to the wonderful Wikipedia for pictures.
See:
http://en.wikipedia.org/wiki/Zimbabwean_dollar
&
http://en.wikipedia.org/wiki/Hyperinflation_in_Zimbabwe
.
New gold highs in Sterling! : 2009-11-25

Wednesday 25th November 2009 at 16:26.

I blinked and I missed it! Over last weekend the gold price zipped past its old all-time high in pounds Sterling of around £693 per ounce set around the beginning of February 2009 and has registered six London Fixes all above £700.

Today 2009-11-25 : GBP 704.45 706.73
Yesterday 2009-11-24 : GBP 708.81 703.30
Monday 2009-11-23 : GBP 702.41 702.87
compared to last week :-
Friday 2009-11-20: GBP 690.83 691.04
Thursday 2009-11-19: GBP 681.55 682.84

Last Friday's close was £696.81 (US$1150.90 with$1.6517:£1), which I think is clearly abover the old high from earlier this year.

Currently at 11:02 NY time on 2009-11-25, 16:02 London time, the Sterling price is £707.33 (or US$1178.40-1178.50 depending on which end of the Kitco page you are reading ,with $1.6660:£1).

What would be bullish for gold? 2009-11-25

Wednesday 25th November 2009 at about 16:00.

If India's Central Bank bought the remaining 200 tonnes of IMF gold. That would be bullish for gold.

What about China? Well, they have been said to have purchased 454 tonnes since 2003. See this article:

China admits to building up stockpile of gold
http://www.financialpost.com/news-sectors/story.html?id=1530063
"...country's [China's] reserves had risen by 454 tonnes from 600 tonnes since 2003."

Maybe they have bought enough for the time being? They were often expected to be going to be the purchasers of the IMF gold but maybe India might take the rest. Either way, these facts are a sure sign of the debasement of the US dollar and other currencies and also of the transfer of wealth from west to east in the world and the impoverishment that is to come for the average people in Britain and America in the future.

Our priest at Kettering Parish Church in England was talking about the gold price this lunchtime after reading about it in the paper.

I think we are in the midst of a spike up in the price that is going to be followed by a major correction at some point. With the news media following moves in gold and the Commitment of Traders net short position in gold at record levels and concentrated in a few powerful bankers' hands, it seems like we are entering a highly dangerous situation for speculators in the near future.

Saturday 21 November 2009

Jim Sinclair's Swiss Stairs in Gold: 2009-11-21

Jim Sinclair's Swiss Stairs in Gold!
Saturday 21st November at 11:50 am

In his great interview on King World News:
http://kingworldnews.com/kingworldnews/Broadcast/Entries/2009/11/13_Jim_Sinclair.html ,

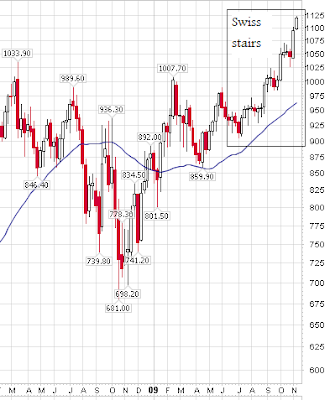
Jim Sinclair talks about the Indian Central Bank's purchase of 200 tonnes of gold from the IMF. He mentions that he could see some market action indicating central bank buying in the gold chart in the 'Swiss Stairs' formation in recent weeks. I recall that he showed an example of a 'Swiss Stairs' formation onb a chart a few years ago on his webaite http://www.jsmineset.com/ and now we see a real one in gold!

I went and looked at the chart on stockcharts.com. Here is the link, look between September and November 2009 at the price action from August to November 2009 at prices fromabout $920 to $1150.
http://stockcharts.com/charts/gallery.html?$gold

Here is my cutout from the chart (click the chart for a better resolution):

Fabulous interviews:Eric King with Jim Sinclair and Pierre Lassonde: 2009-11-21

Fabulous interviews:Eric King with Jim Sinclair and Pierre Lassonde: 2009-11-21
Saturday 12st November 2009 at 11:43 am

Two really superb interviews by Eric King (two of many, a superb site) were put on last week. One is with the legendary Mr. Gold, Jim Sinclaur, the other is with Pierre Lassonde, former boss of Franco-Nevada and Newmont Mining.

Jim Sinclair:
http://kingworldnews.com/kingworldnews/Broadcast/Entries/2009/11/13_Jim_Sinclair.html

Pierre Lassonde:
http://kingworldnews.com/kingworldnews/Broadcast/Entries/2009/11/6_Pierre_Lassonde.html

They are both well worth a listen!

So is the Matt Simmons interview regarding Peak Oil on the same website:
http://kingworldnews.com/kingworldnews/Broadcast/Entries/2009/11/13_Matthew_R._Simmons.html

Happy listening!

Gold closes at weekly high for second week! 2009-11-21

Gold closes at weekly high for second week! 2009-11-21
Saturday 21 November 2009 at 10:51

Here are the closing prices from Kitco on Friday night:

Bid/Ask: 1150.90-1151.90
Low/High: 1150.90-1151.90

So it closes at the exact high at the end of the week. I have heardly ever seen this before in 8 years watching the gold market. Except for last week, when gold closed practically at the high on Friday's close.

Nov 13, 2009 17:15 NY Time
Bid/Ask 1118.50 - 1119.50
Low/High 1101.90 - 1120.40

Is that bearish action?

Maybe we do have a speculative fautures rally right now as John Nadler states in te LA Times.
Gold market disconnect: Record prices, but not demand
November 20, 2009 2:42 pm

The Commitment of Traders (COT) report shows an all-time record of short position of the major gold banks; this often happens before a big price tumble. However, on new gold price highs, these positions have tended to increase higher than at the previous peak. See this great essay on gold Commitment of Traders numbers by Adam Hamilton at Zeal Intelligence:
http://www.zealllc.com/2009/goldcot3.htm
and it might be a good idea to take a look at its predecessors too.

Remember that this time last year, gold dipped to $680 from $1000 during the credit crunch and demand was up a lot at that $680 price. Premiums on coins were huge (I heard from a coin dealer this week that at a major coin show, premiums on US pre-1933 $20s are huge again).

Perhaps you can't expect demand at $1150 to be the same as demand was a year ago at $680!

Although it is Indian gold demand that is supposed to be down this year (apart from their central bank buying 200 tonnes at $1045 per ounce a couple of weeks ago, perhaps showing the lead to their people), Kitco linked to this article. Interesting.

In India, you're in gold's own country - Times of India, Nov 21 2009 2:03AM

Friday 13 November 2009

Forecasting skills of John Nadler = C-minus. 2009-11-13

Forecasting skills of John Nadler = C-minus. 2009-11-13

It was time to take a look and try to find what perennial bearish John Nadler at Kitco who is the wet blanket for all gold investors had forecast for the 2008 price. I seemed to recall that he mentioned about US $740 as the price for gold for 2009 but I might have been wrong, so I listened to some downloaded interviews and then google'd a bit:

Here he mentions India’s Associated Chamber of Commerce and Industry (Assocham):http://www.kitco.com/ind/nadler/feb262009A.html
who forecast:
"$740 price for same, come next year. Start sending them 'why are you a bear' e-mails, shall we?"
on 26 Feb 2009.
He seems to give this some credibility. Maybe he mentioned this price in some online interview around that time. He added:
"some players see every day that passes with gold spending time above $900 as a reason for messianic fervor. ... The L.A. Times finds that 'gold already has been widely labeled "the next bubble.' "
There's always hope, eh, John?

Here:
http://arch0708.goldtent.net/2007/10/24/kitco-is-a-cretini-knew-it/
from 24 October 2007.
"Nadler’s forecast was $665 for one year from now and $775 in five year’s time."

Actually he wasn't that far off on the first one because gold dipped to about $680 in the credit crunch.

The weekly chart on stockcharts.com :
http://stockcharts.com/charts/gallery.html?$gold
shows the low of 681 that occurred in October 2008 so he gets an 'A' grade for that one, falling into the deflationist camp with Robert Prechter I guess. No gold bugs predicted that so it is not wise merely to dismiss John Nadler. However the deflationists are a bit like a stopped clock. They were correct on one occasion, that was September to November 2008. Will they be right again?

However, John is getting a D-minus or possibly an F for his 2009 forcast because as you can see from adding a 45 week moving average to the weekly chart for gold, the average price for 2009 is around $950-960, so he is low by a clear $200!

A poster here recalls a forecast for $640!
https://www.kitcomm.com/showthread.php?t=52872&page=4
"$640 gold in 2009 predicted Mr. Nadler. Is there no accountability for guys like this"

Here he proposes that 2009 investment demand will slow:
http://cosmos.bcst.yahoo.com/up/player/popup/?rn=289004&cl=16587014&src=finance&ch=633473
and says will it end up at $900, 800 or 700 - he's not sure, no mention of $1100!

This post recalls:
https://www.kitcomm.com/showthread.php?t=52872
"John Nadler, senior Kitco analyst, predicted gold would trade between 640$ and 940$ an ounce for 2009. At the moment, gold is over $1100 an ounce."

On The Gold Report interview he says:
http://www.kitco.com/ind/GoldReport/oct272008.html
TGR: Earlier you suggested that in a deflationary period or one just slightly inflationary, gold might be somewhere in the $500-$600 range. But over the longer term, you think it is more likely to stabilize somewhere between $650 and $850?
JN: I think that’s what we’re looking at in order to reflect current levels of supply and demand, basically make the mining community reasonably happy and keep India buying, which it’s currently not. Anything over $850 is just too much as far as they’re concerned, and they’ve demonstrated that stance for most of this year. ... We’re in Indian Festival season and they’re lamenting about very poor sales.

One thing he mentioned that I missed:
"I think in part that’s one of the things that delayed supplies from Valcambi, one of the refiners in Switzerland, which is probably trying to focus on ramping up to send a gazillion one-gram coins throughout India"

True that Indian demand has been low in 2008 and now also in 2009. Except for the Indian Central Bank, that is!
India buys 200 tonnes of IMF gold - Telegraph
3 Nov 2009 ... The International Monetary Fund has sold 200 tonnes of gold to the Reserve Bank of India for $6.7bn (£4.1bn). The sale represents almost ...
ACtually, I am not sure they are correct there. It's half of what they are selliing, ie half of 400 tonnes for sale. They have more but technically doesn't it belong to the central banks of the member countries. So perhaps it's half of the maximum they can sell without taking it from the member countries' banks. Too complicated! Ever wondered if some of this central bank gold could have multiple claims against it?

http://www.kitco.com/ind/nadler/jan082009B.html
Meanwhile, on the price projections front, our friends at HSBC have issued theirs today, and they read as follows according to Reuters' Jan Harvey
"HSBC raised its 2009 gold forecast to $825 an ounce from $800, and its 2010 price view to $775 from $725, but left its long-term forecast at $700."

No mention of Bill Murphy's forecast!!!!!!! ;-)

Even deflationist Mike Mish Shedlock disagrees with Nadler's assertion that gold is not in a bull market (Nadler echoes here Paul van Eeden's opinion):
http://www.marketoracle.co.uk/Article14731.html
It seems to me that if gold isn't in a bull market then nothing is!

Here:
http://www.kitco.com/ind/nadler/aug152008A.html
he said,
"If anything, festival-related buying might prevent a faster meltdown towards $700, but if the trends in commodities continue along their current path, it will not be able to turn the gold market ... around and back into bull mode," said Nadler.

Fair enough but the commodities trends did reverse so his caveat was met. However, he seems to love being pessimistic on the gold price!

HOWEVER,

'Even so, Nadler said he remains a "strong advocate of a core insurance position in gold bullion. Trouble, it seems, is always but one headline away from undoing the best-laid plans." '

Isn't that fair enough? With these pullbacks gold bugs get the chance to load up yet another time!

As long as you don't die before you can cash in a good profit!

Thursday 8 October 2009

25 Gold Prices over $1000! 2009-10-08

Thursday 8th October 2009 at 23:03
25 London Gold Prices over $1000!

Taken fromL
http://www.kitco.com/gold.londonfix.html
Past Historical London Fix - Current Year

Date
Gold AM
Gold PM

2009-10-07
1047.00
1040.25

2009-10-06
1020.25
1038.75

2009-10-05
1004.25
1005.50

2009-10-02
998.00
1003.50

2009-10-01
1005.75
1004.75

2009-09-30
1001.25
995.75

2009-09-29
991.75
989.50

2009-09-28
990.50
991.75

2009-09-25
997.00
991.50

2009-09-24
1014.00
1009.75

2009-09-23
1014.75
1010.25

2009-09-22
1015.75
1014.00

2009-09-21
999.25
997.00

2009-09-18
1014.00
1012.00

2009-09-17
1020.50
1018.50

2009-09-16
1017.00
1015.75

2009-09-15
997.50
996.00

2009-09-14
994.25
999.25

2009-09-11
998.25
1008.25

2009-09-10
988.50
990.75

2009-09-09
995.75
999.50

2009-09-08
1004.50
1000.75

2009-09-07
992.75
993.00

Wednesday 7 October 2009

Alert: Martial Law in the UK 2009-10-07

Alert: Martial Law in the UK 2009-10-07
Wednesday 7th October 2009 at 10:50 am:

So the cat is finally out of the bag. We were due for martial law in the UK as the banking system collapsed in late 2008. See this Bloomberg story.
http://www.bloomberg.com/apps/news?pid=20601087&sid=aMfETcYI2t7Y

It reads almost identically to rumours from the meeting in US government circles in 2008, when some so-called 'alarmists' were stating that martial law had been discussed.

It's an interesting report, to say the least. I love it how the interviewees spin this situation as, "Oh yes there would have been pandemonium if the banks failed and if trust in the payment system broke down. People would have had to fend for themselves."

That's what people are supposed to do . Of course, statists (socialists and fascists) believe in total government, as did the nazi and communist regimes of the 20th Century. People acting independently of government is the worst thing they can imagine - they would be out of a job.

So we finally have it in print that the British state might have used the army against the people under the guise of public order and distributing food perhaps. Ha! Where is the army anyway? Aren't they all out of the country, fighting the British state's wars in Iraq and Afghanistan?

Gold has spiked up to $1045 yesterday on rumours (which like the martial law rumours may turn out to be facts) that American's creditor nations are considering using currencies other than the US dollar for oil trading). Rumour or not, mud will probably stick eventually. I think we are in trouble in the US and UK. :-(

Monday 14 September 2009

Gold conspiracy, quantitative easing, OTC derivatives 2009-09-14

Gold conspiracy, quantitative easing, OTC derivatives 2009-09-14
Monday 14th September 2009 at 20:17 BST:


Some interesting links, money and gold conspiracies, OTC derivatives nightmares, dehedging in a hurry and China.

Blog here, interesting:
http://jessescrossroadscafe.blogspot.com/

Article on Barrick, not too sanguine about them:
http://news.goldseek.com/GoldSeek/1252609733.php

Jim Sinclair says OTC derivatives nuke is about to explode:
http://jsmineset.com/
saying,
"Can you blame China for simply saying no to Western crack cocaine finance?"

Hugo Salinas Price on bringing gold and silver back to the mint:
http://news.silverseek.com/SilverSeek/1252786770.php

and a fascinating intervew by Eric King on his website of Bill Laggner regarding money printing, quantitative easing, government fraud and another cming financial storm. He sees the 2008 credit collapse turning into a currency collapse. He just said that he has gone from net short 225% to net short 60%. PHEW! That's not a recommendation by the way! He sees 15-25% decline in housing in prime mortgages, collateral values declining, Fed is impotent.

All worth a read. Or a listen, as in the last link.

_

Sunday 13 September 2009

Last chance for gold under $1000? 2009-09-13

Last chance for gold under $1000? 2009-09-13
Sunday 13th September 2009 at 22:40 BST:

The market seems enthusiastic to push gold above $1000 but some analysts are now not so sure:

Bob Hoye on http://www.howestreet.com/ expects that gold and silver prices have had a good run but that it may come to an end with the gold:silver ratio going up again as silver and other commodities fall relative to gold in another deleveraging this autumn. He expects gold to outperform silver if we get another credit crunch and a fall in most markets. Bob is a witty and very wise market expert, very laid-back style, almost horizontal!
Discussion here: Autumn Anxiety *AUDIO*

In the goldseek radio Dr. Marc Faber & Chris Waltzek discussion, Marc Faber said that he thinks there is a bit too much enthusiasm for gold right now at $1000 to make this the big move in gold.
This is a page worth bookmarking, the Goldseek radio nuggets page with the main commentary by one individual expert: http://www.radio.goldseek.com/nuggets.php

David Morgan on http://www.financialsense.com/fsn/main.html newshour 12 September 2009 first section says he thinks that maybe this might not be the last ever chance to get gold under $1000 for similar reasons.

One of the main reasons for the scepticism is that the gold and silver COT (Commitment of Traders) are showing more or less record commercial short positions, usually the sign of an interim top. The above events may possibly influence the price to the upside, so is a commercial signal failure followed by a large upward spike in gold due to short covering (a short squeeze) possible? Hear Ted Butler on King World News and John Rubino on www.Howe Street.com.
Ted Butler September 12th: Ted Butler on the Metals Market
John Rubino on Howestreet: Gold Roundup *AUDIO*
Also on Goldseek: COT Gold, Silver and US Dollar Index Report - Septemer 11, 2009

However, Dave Skarica on Howestreet thinks that it's a A Bullish End To A Wild Week *AUDIO* and he thinks that gold has had its breakout with the gold stocks breaking out too (given the performance in the HUI Gold Bugs' Index). See his charts in an Acrobat Reader .pdf file next to the broadcast link. He can really talk! Very interesting. 'NG-AU-AG-HUI all had a strong week Click for Dave's charts.'
_

Thursday 10 September 2009

Gold - a torrent of news China, Barrick etc. 2009-09-09+

Gold - a torrent of news China, Barrick etc. 2009-09-09+
Wednesday 9th September 2009. 09/09/09 09:09:09 hrs onward:

1. China may default on some derivatives contracts, especially in oil.
China threatens to default on oil derivatives trades - BloggingStocks ,
WRAPUP 1-US commodities rattled by China derivatives stance ...
http://www.mineweb.co.za/mineweb/view/mineweb/en/page72068?oid=89018&sn=Detail

2. China has suggested in a government broadcast to its people that they buy gold and silver.
China pushes silver and gold investment to the masses

3. Hong Kong has let it be known that it wants its sovereign gold to be brought from London to a new high security vault at Hong Kong airport. The gold might be used as a backing for the Shanghai Metals Exchange.
Hong Kong recalls gold reserves from London - MarketWatch ,

4. Barrick is buing back its hedge book, apparently in a big hurry:
Barrick to sell $3 billion in stock to buy back hedges Reuters ,
Why Barrick reversed its gold-hedging strategy‎ (Globe & Mail),
Has Barrick Been Barricked By The U.S.? by Antal Fekete.

5. The gold and silver COT (Commitment of Traders) are showing more or less record commercial short positions, usually the sign of an interim top. The above events may possibly influence the price to the upside, so is a commercial signal failure followed by a large upward spike in gold due to short covering (a short squeeze) possible? Hear Ted Butler on King World News and John Rubino on www.Howe Street.com.
Ted Butler September 12th: Ted Butler on the Metals Market
John Rubino on Howestreet: Gold Roundup *AUDIO*
Also on Goldseek: COT Gold, Silver and US Dollar Index Report - Septemer 11, 2009.

6. Jim Dines has suggested on King World News that Rare Earth elements are going to be in a super-bull market.
James Dines

7. Rick Rule on King World News acknowledges that a bull market in 'alternative' energy is very likely but he sees geothermal and hydro as being the two that are viable in the free market without government subsidies.
Rick Rule

8. NOW A BULLISH VIEW: Dave Skarica on Howestreet thinks that it's a A Bullish End To A Wild Week *AUDIO* and he thinks that gold has had its breakout with the gold stocks breaking out too. See his charts in an Acrobat Reader .pdf file next to the broadcast link. He can really talk! Very interesting. 'NG-AU-AG-HUI all had a strong week Click for Dave's charts.'

As an aside to this but highly important for the future, will China allow their Yuan currency to appreciate against the US dollar? In other words a dollar devaluation with respect to Asian currencies. Marc Faber thinks so on goldseek.com this weekend.
Dr. Marc Faber & Chris Waltzek on their useful 'nuggets' page to bookmark:
http://www.radio.goldseek.com/nuggets.php

Also, see Mish Mike Shedlock's article
http://www.howestreet.com/articles/index.php?article_id=10646
and the often fascinating LEAP article with a highly European perspective:
http://www.leap2020.eu/When-China-prepares-its-Great-Escape-from-the-dollar-trap-for-the-end-of-summer-2009_a3582.html

Happy reading! I am going to try to post relevant links most weeks in a post like this, especially if we get a big move in gold.

By the way, Bob Hoye on http://www.howestreet.com/ expects that gold and silver prices have had a good run but that it may come to an end with the gold:silver ratio going up again as silver and other commodities fall relative to gold in another deleveraging this autumn. Dr. Marc Faber & Chris Waltzek discussion has Marc Faber saying that he thinks there is a bit too much enthusiasm for gold right now at $1000 to make this the big move in gold. Dave Morgan on http://www.financialsense.com/fsn/main.html newshour 12 September 2009 first section says he thinks that maybe this might not be the last ever chance to get gold under $1000 for similar reasons.

That's it for this weekend!
_

Monday 7 September 2009

SP500 and Dow Jones Megaphone charts 2009-09-07

S&P500 and Dow Jones Megaphone charts

Monday 7th September 2009 at 18:04


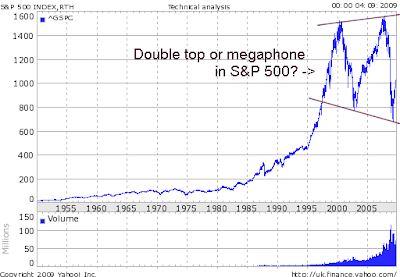
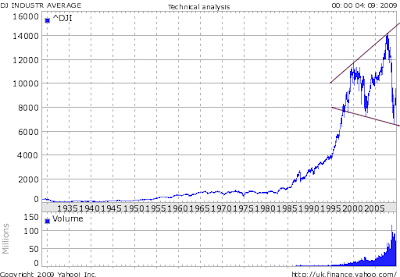
Here are two charts of the S&P500 and Dow Jones with megaphone (top?) formations, as described in my previous post:
Inflation Deflation debate on financialsense.com 2009-09-06

I think that they may indicate increasing episodes of alternating deflation and inflation that may continue to alternate leading to some kind of collapse at the end, because megaphone patterns tend to be bearish and resolve with a breakdown below the lower trendline.

I am going to look for more evidence to see if it is likely that we get alternating inflationary and deflationary episodes during the current crisis and to see if there is any precedent for this.

Dow Jones megaphone:


S&P 500 megaphone? :


Inflation 1980s-2000:
Long term bull market in stocks, bonds and property with few interruptions. Topped 1999-2000.

Deflation 2000-2003:
Small debt defaltion and falling asset prices, stock market crash.

Inflation 2003-2008:
Massive inflation in debt instruments and derivatives, very low interest rates at 1% , huge property bubble, commodities rising, price inflation, rising stock markets, some to new highs.

Deflation 2008-2009:
Larger debt deflation, banks bankrupt, financial panic, stock market crash.

Inflation 2009-now:
Massive injections of liquidity into bankrupt financial systems, ultra-low interest rates of zero-0.25% in USA (similar to Japan in late 1990s to present day). So what happens next?

Deflation? 2010?:
Massive bank failures, debt repudiation, market crashes, negative CPI.
or does the present 2009 trend morph into Hyperinflation?


Here are three of my previous blog posts before last year's panic:


Inflation/Deflation debate is BUNK! 2008-05-29.

Megaphone top in Dow:Gold ratio? 2008-06-03

Chart hints at Financial Disintegration: 2007-12-23)

Inflation Deflation debate on financialsense.com 2009-09-06

Monday 6th September 2009 5:03 pm:
Inflation Deflation debate on financialsense.com

Bon Prechter the archetypal deflationist was interviewed by Jim Puplava on http://www.financialsense.com/ this Saturday. Very interesting. He admitted that he hadn't expected that there would be one last 'final' reinflation after the recession of 2001 (he had expected the deflaiton to start in 2000-2001), but he was convinced that the events of 2007-2009 were exactly what he had predicted in his book 'Conquer the Crash' many years earlier. The book has been updated for a new edition and is going to print, by the way.

Jim Puplava is going to interview two inflationists followed by one more deflationist in the following couple of weeks. If they are as good as Prechter's interview then they will be very informative and intellectually stimulating.

Myself, I wonder if we are going to see something different from the big hyperinflaation or big deflation that the inflationists and deflationists are touting.

I think it is possible that we might see alternating periods of inflation and debt deflation, because we have actually seen this already:

1980s-2000: Long term bull market in stocks, bonds and property with few interruptions.
2000-2003: Small debt defaltion and falling asset prices, stock market crash.
2003-2008: Massive inflation in debt instruments and derivatives, very low interest rates at 1% , huge property bubble, commodities rising, price inflation, rising stock markets, some to new highs.
2008-2009: Larger debt deflation, banks bankrupt, financial panic, stock market crash.
2009-now: Massive injections of liquidity into bankrupt financial systems, ultra-low interest rates of zero-0.25% in USA (similar to Japan in late 1990s to present day). So what happens next?

These periods coincide almost exactly with stock market rises and crashes.

1) Liquidity injections not sufficient to offset debt collapse and asset deflation: result, another banking crisis and deflation, possibly hyper-deflation and comlete deleveraging of economy.
2) Liquidity injections sufficient to prevent debt collapse, possible spillover into many asset markets and consumer prices: resulting high inflation or even hyperinflation.

No-one seems able to give a really convincing argument to back either of the above cases, possibly because nobody knows the answer!

I have a feeling that we might be in a new stock bull market that could take us to yet a new nominal high in the Dow Jones, as per 2003-2007, or to a high in the 14000 area. However, Prechter's argument is that there has been a socio-economic change in 2008 that makes this impossible and people are not going to take on more debt.

The large increase in the savings rate agrees with Prechter, as did the rally in the US dollar in 2008 that corresponded to the unwinding of the 'synthetic dollar short position' that the deflationists were postulating before this event. The deflationists were correct: dollars were raised in a hurry to pay off debts and to refill destroyed bank reserves, resulting in a very sharp US dollar rally in late 2008. In that case, we see either a low trending market or another crash coming soon because deflationary forces could be dominant. Many inflationists (even very clever ones such as Jim Sinclair) scoffed at the synthetic dollar short position argument, but it did happen!

My feeling is that, since there is no convincing argument to determine whether the Federal Reserve, the ECB and the Bank of England can re-ignte inflation to balance the deflation which is the natural process that would happen in their absence, then we might be in for alternating periods of inflation and deflation, which might increase in amplitude as the debt collapse continues.

I note that the stock market, well the Dow Jones (and the S&P500) anyway, made a high in 1999-2000, a low in 2003, a higher high in 2007 and two slightly lower lows in 2008-09, we have another possible megaphone formation in progress, much like the megaphone in the Dow to gold ratio that has been forming since the 1920s. In other words, the market values of assets are increasing in uncertainty as this crisis unfolds, possibly leading to a catastrophic collapse at the end of this period.

Bob Prechter is expecting a major deflation in the 2010 timeframe, larger than the one in late 2008, once the present 2009 inflationary episode is over. In his view, the Fed's purchases of non-performing assets in 2008-09 will not generate inflation because they were more or less targeted as loans to specific institutions to replace the non-performing assets with existing Treasury bonds, rather than freshly 'printed' money, as I understand it. And when more assets fail, such as in the commercial real estate, prime mortgages and leveraged buyouts, many more defaults will come and deflation will continue, sending markets to new lows.

Here are two of my previous blog posts before last year's panic:
Inflation/Deflation debate is BUNK! 2008-05-29.
Thursday 29th May 2008: Inflation/Deflation debate is bunk.
and
Megaphone top in Dow:Gold ratio? 2008-06-03
Tuesday 3rd June 2008: Megaphone Top in Dow:Gold ratio?


Charts for new post:


Dow Jones megaphone:


S&P 500 megaphone? :

Thursday 13 August 2009

7 months later, still under $1000 - 2009-08-13

2009-08-13 at 23:55: 7 months later, still under $1000

Wow, I am back online. In the last few months, I was looking after my elderly Dad, who has now sadly passed away, God bless him.

During this time, nothing much has happened. No significant new bank meltdown, gold still consolidating under $1000, so I didn't miss much in the gold world.

Friday 30 January 2009

Obama with more power than Bush 2008-01-30

Obama with more power than Bush 2008-01-30 1:26 p.m.

<<>>

Who said that? I like it. It's a good quip.

I was a bit amazed by how Obama was saying in his speech about all these things that the Americans need to build, you know, railroads, roads, bridges and all the like. Maybe oil refineries would be a good idea too!

Anyway, one might wonder where is the money for all this stuff and of course it will all be printed money. Why weren't all these things built during the boom when there was actually some money? It's not the time to build them now - America is broke (and so is the UK of course!)

However, I suppose you can never underestimate how the ruthless ruling class can pull some "magic" rabbit out of the hat.

I pondered to my Dad last night and wondered if the bear market in everything might have been finished (the deleveraging, the "deflation") and we might be infor the inflation soon. I said to him that last year everyone was expecting the crisis to be postponed until after the election so that the Republicans might win. The opposite happened. The whole thing went completely tits up just before the election and the republicans got shafted.

Now the newly elected Obama seems to have a huge store of goodwill and euphoria over his victory. Bush gone, everyone is happy. Race equality, the era of slavery finally put to rest, eveyone is happy, so they think. (Wicked thought: Maybe Equality = slavery for everybody!)

Maybe the elite stuck Bush with the worst of the crisis.

Anyway, now Bush "Shrub" is gone, Obama has so much goodwill right now that he could take far more emergency actions and powers than Bush ever could, before the angry public took to the streets, couldn't he? That is superb for the elite, don't you think? Obama is a gift for them. During the first Great Depression, Roosevelt (FDR) nicked all the gold, nobody cared, devalued the dollar, nobody cared, took USA into WW2, nobody minded; they loved him, gave him 4 terms!

Wednesday 14 January 2009

Did we have Hyperinflation already?

Hyperdeflation scenario:
Could we get hyper-deflation of the $500 Trillion derivatives pyramid - a total and instantaneous deleveraging? This could all happen in a single day or even a single hour and no-one will be able to get out of the way. It could come like a thief in the night.

Hyperinflation scenario:
However, if the Fed succeeds in stopping this process or event, it will mean that they will have committed hyperinflation to cover all these potential failures, having possibly had to underwrite or monetise all several hundred trillion of derivatives transactions. Taking $500 Trillion as an estimate of derivatives' notional value, that would mean a 40x increase in money supply (M3 being about $13T - and US GDP being about the same). That's 4000% inflation guaranteed then, if the Fed succeeds."

Now, considering the above, have we already had the hyperinflation that may on the web have been discussing as being in the future?

1) Firstly, we have had a 100-fold increase in prices in the last 90 years, since the inception of the Federal Reserve and the first ending of the Gold Standard in 1914.
2) Secondly, we have had hyperinflation in the notional value of derivatives transactions at a far higher rate than that of the traditional measures of money supply M1, M2 M3, MZM, TMS, Adjusted Monetary Base, etc.

It seems to me that the measures of traditional money supply are becoming irrelevant as the leverage increases and the derivatives streak ahead of all measures of savings, cash and GDP.

Taking $500 Trillion as total notional derivatives value, that is 40 times the US money supply, 40x the US GDP and 10x the world GDP. Would a 2.5% wipeout in derivatives notional value wipe out the US GDP? I don't know!

It would be fascinating to see the figures from the Bank of International Settlements (BIS) http://www.bis.org/ for derivatives transactions notional value for year end 2008, to see if they decreased in the second half of 2008 as they should have done with this present 'deleveraging' - or if they actually increased.

Try this link http://www.bis.org/statistics/derstats.htm and download Table 19: Amounts outstanding of over-the-counter (OTC) derivatives by risk category and instrument, i.e. http://www.bis.org/statistics/otcder/dt1920a.pdf.

As of June 2008, notional value outstanding of Over the Counter (OTC) derivatives was 683,725,000,000,000 (683 trillion) and the Gross Market Value of these was 20,353,000,000,000 ('only' 20 trillion). That presumably excludes all derivatives traded on exchanges, since these are just the OTC figures! What do these figures really mean?

Forecasts for 2009.

Well, not much happened since I last posted here. Apart from the near total collapse of the entire Western world's banking system and the near fulfillment of 'The Fall of Babylon' from Chapter 18 of the Book of Revelation in the Holy Bible.

Apart from that, pretty uneventful, then.

Everything that happened was predicted long ago on such talk radio shows as http://www.financialsense.com/, http://www.kereport.con/ and http://www.goldseek.com/ and by Peter Warburton's 1999 book 'Debt & Delusion', aptly subtitled ' Central Bank Follies that Threaten Economic Disaster'. Now all the things that were talked about by these much ignored Austrian school economists have come to fruition and appear on the mainsteam news almost every day. Though of course no-one there would give the predictors of the crisis any credit for their astute observations of the credit excesses of the last decade and the likely consequences.

We have gone from the danger of hyperinflation in early 2008 to the danger of hyperdeflation in late 2008. The Federal Reserve has underwritten about 8 Trillion US$ of non-performing 'assets' in the USA, though that is peanuts compared to the several hundred trillion US$ of derivative contracts outstanding.

With most of the world's investment money in US Treasury bonds and yields and Fed interest rates at or near zero, with a seemingly confortable gap since the last major bank failure, we are now almost perfectly set up for:

1) A collapse in the Credit Default Swap derivative market - a collapse of credit insurance.
2) The collapse of a massive banking institution that was deemed 'too big to fail'.
3) Total systemic banking failure and a halt in world trade along the lines of 'The Fall of Babylon' described in Revelation Chapter 18.
4) The default of the USA and many other countries on their sovereign debt leading to a collapse in public services due to unprecedented government debts and a catastrophic fall in tax revenues.

The above can be summarised as hyper-deflation of the derivatives pyramid - a total and instantaneous deleveraging. See next post.

This could all happen in a single day or even a single hour and no-one will be able to get out of the way. It will come like a thief in the night.

However, if the Fed succeds in stopping this process or event, it will mean that they will have committed hyperinflation to cover all these potential failures, having possibly had to underwrite or monetise all several hundred trillion of derivatives transactions.

Taking $500 Trillion as an estimate of derivatives' notional value, that would mean a 40x increase in money supply (M3 being about $13T - and US GDP being about the same). 4000% inflation guaranteed then, if the Fed succeeds.

So, be prepared, if that is possible.