Monday 21 December 2015

Can someone please tell me why gold is not in a secular bear market?

21 December 21, 2015 at 9:28 pm GMT:

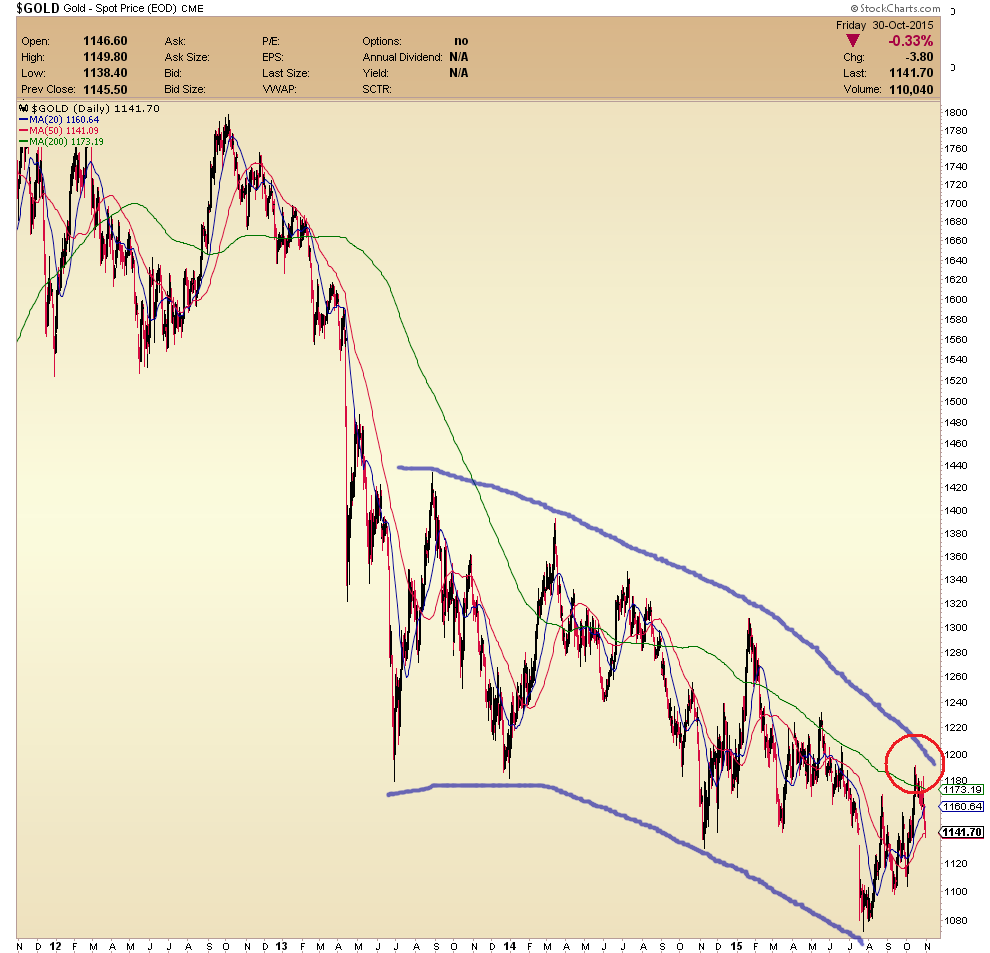
I really would like any gold market analyst to lay it on the line and tell us why they think that gold is not in a SECULAR bear market, giving us good reasoned arguments for the continuation of a secular bull market, whether technical or fundamental.
I see the current chart pattern as kind of midway between the secular bear market of 1980-1999 and perhaps the cyclical bear in 1974-1976. There seem to be some features from both in the current price action in gold. The timing of this bear market is about the same as for an entire 7-8 year dollar bull market cycle on its historical chart, though gold overshot to the upside when the dollar had already bottomed between 2008-2011.
So gold could have a great upmove on the next USD down cycle perhaps from 2016-2024. That would be nearly a perfect fit. It would also make the entire last 25 years of price action (1999-2024) a gradual version of the 1971-1980 bull market but this time fitting better to the 7-8 year dollar up and down moves.
The sticking point for me is if we have real deflation and real trouble in the EU and Japan and other countries leading to a secular trend change in the US dollar index to the upside, cancelling out its last 30-45 years of devaluations.
Here was some of my other reasoning from another post:
I still can’t make up my mind whether gold is in a cyclical or secular bear market. Oil and platinum for instance obviously have been in secular bear markets since 2008. Gold was late to turn in 2011.
I keep looking at the 2011 top in gold versus the 1980 top and the 2011 top was not so extreme. However, there was less inflation in 2011 than 1980 so inflation adjusted the difference between the two bull moves are smaller than the nominal price values suggest. Gold has been a more liquid market in this bull run with more nations participating, more paper products, more leveraged products and more mine supply than in 1980. So one would not expect a secular bull market top to be so extreme. In the same way, a Dow bubble top now would not be expected to be as extreme as in 1929.
I we look at the current gold bear market, the correction has been less extreme than in the 1980s and for silver this is even more true (silver was down about 90% from 1980 to 1982 alone). However, again, the increased liquidity and diversity of these markets might account for this and not be an excuse to think that we are not in a secular bear market for both, especially if other commodities are in secular bears already.
Eventually there will to be a US dollar bear market cycle and I wonder how it can take the dollar to new lows and gold to new highs considering the mess in the Eurozone and Japan and their increasing monetary debasement. In that case can we expect a dollar down move from 2016-2024 perhaps to produce new highs in gold? I wonder.” 

Originally posted on The Korelin Economics Report daily show here:
http://www.kereport.com/2015/12/21/docs-comments-gold-oil-stock-markets/

Answers on a postcard please either at the above link or at this one:
http://goldtadise.com/?p=358311

Monday 7 December 2015

Bounce in gold - is it now over? Monday 2015-12-07 19:41 GMT

Is the dead cat bounce in gold now over? A bounce that fails to get to a round figure (this time $1100) would be typical of most of the price action over the past 2.5 years.

Further to this, the upmove at the end of last week failed to bring gold back over 1000 Euros. So Euro gold is back in 3 figures again. Kitco has it at 991.78 EUR (-5.50 EUR on the day).

In Sterling, gold bounced at about 700 GBP, breaching below 700 on the last swoon but now at 713.81 GBP (-5.37 GBP on the day). 700 GBP is a key level that has been tested in the last couple of years and breached only very temporarily.

Last Friday was a big up day for gold in all currencies quoted on Kitco but still it is under 1100 USD, under 1000 EUR and I think there is danger to go back under 700 GBP, perhaps for a sustained period of time as gold is already flirting with thee figures in USD terms.

Thursday 3 December 2015

'Three peaks and a domed house' patterns revisited in gold and silver.


Here they are. These are 3 peaks and a house patterns revisited in gold and silver from August 2011.

The target on silver was $12.44 and on gold it was $1155. As you can see, silver had already made its top near $50 at point Z and was on its way down into the $30-40 range when I annotated the chart. Now it is $14:


Gold has of course already exceeded its $1155 target to the downside as of the end of 2014 and is now at $1060 as of late 2015. Again, this chart was made in August 2011. The breakout happened much later in gold and was much shorter in duration. It was only another month or less to the gold top price of $1920 when this chart was drawn:


Friday 27 November 2015

Re-visiting old chart with gold target of $780.

I never posted my gold bear market chart with the $780 target, so here it is. I cannot update this because I no longer use this particular charting service.

I regarded the $730 high in 2006, the $1030 high in 2008 and especially the $680 low in late 2008 as key points to try to draw median lines of some kind. I noticed a pattern where the impulsive move up to $1920 is a larger version of the impulsive move to $1030 from 2008. On the score there is a possible target of $780 for gold, depending on the time-frame since the target line is sloping.

My estimate for this low was perhaps in 2015 and here we are. This chart was drawn in early 2014:


Wednesday 11 November 2015

Breakout from long term US dollar bear market since 1971?

I have asked Rick Ackerman on www.kereport.com blog what he thinks about the possible reversal of the generational downtrend in the US dollar.

For 45 years, we have had typical US dollar bull and bear market cycles:

8 years down 1971-1979
6 years up 1979-1985
7 years down 1985-1992
9 years up 1992-2001
7 years down 2001-2008
9 years up? 2008-2017?

That is about an average 8 year bull and bear cycle.

In this interview,

It sounds like Rick is forecasting that the last 45 years action in the US dollar with lower lows in every cycle is not going to be followed and the normal cycle is going to break.

In that case, it seems that it might be more likely to break to the upside if he says the up-cycle will continue for another 5 years, that gives a dollar top in 2020 and a 12 year bull market in the dollar!

The reason for this could be that we are in a once in a century deflation event like the one in the 1930s. So perhaps we shouldn't expect the dollar index to behave as it has in the past 45 years because they are irrelevant to the current events

This has all kinds of implications:

One might be that the dollar could have turned up into a secular generational bull market in a break from the past 45 years of its making lower lows.

It also would imply secular bear market in the Euro contrary to European currency strength versus the USD in recent decades. Perhaps it would go hand in hand with disintegration of the Euro and the European Union whose integration was coincident with its generational bull market ending in 2008.

It could also imply deflation and a long period of it, not atypical in a credit contraction after an exceptional financial bubble.

That might put an end also to the commodities cycles that tend to run inverse to the US dollar, so perhaps the commodities bear market has further to run and looking at recent lows like the 2008 lows or 2001 lows in commodities as a guide is irrelevant.

It might also imply that there will be no continuation of a secular gold bull market perhaps for many years but perhaps some kind of trading range at relatively subdued levels for many years.


Saturday 31 October 2015

Bearish curves on gold chart from last 2+ years

Looking at this weekend gold chart, I noticed that there are bearish curves on gold chart from last 2 years. Ol' Jim Sinclair used to say about 10 years ago that one should have a set of parallel rulers and some French curves to do charting.

Instead of drawing a falling wedge, one might instead encompass the last 2.5 years of price action between two steepening down curves.


Well, here are some curves on the gold chart that do not look too good.

In sketch form, if the recent high circled in red is the high for this current move, then there might be a lot more downside to come. This recent up cycle looks a lot like a stunted version of the previous up cycle from January 2015:


Looking from an even more bearish perspective, this last 2+ years of action mirrors the action in late 2012 to early 2013. We are again at the 4th high of a series of falling highs. Last time, the 4th high was the failure to hold above $1600. This one is the failure to get to $1200. Geronimo?

I am beginning to realize that you can draw almost anything on one of these charts but I do not like at all the downside acceleration of both the highs and the lows. It is ongoing as far as I can see. Who knows when it will end?


The 2012-2013 down move culminated oi the mid-April crash in gold on 12 and 15 April 2013. Immediately preceding the crash there was a failure to hold above $600 (high number 4 in purple/green on the chart) and just after that an abortive little bounce that went to about $1590, failing to reach $1600. That ushered in a $270 drop within a very short space of time.

This time around, we have the recent rally to $1190 (high number 4 in blue/red on the chart). The price failed to hold over $1180 which is key horizontal resistance dating back to the lows of June and December 2013. Very soon after we had a little bounce that failed to reach $1180. This might be an indication that gold is about to break down severely.

Here is a better chart with proper parabolas drawn for me by one of the lead contributors at http://www.goldtadise.com, which I would thoroughly recommend joining:


Last week's sharp selloff could be very bad news. Unless the price rallies to above $1180 or at least spends at least a number of weeks trading sideways, there is a chance of an imminent second crash in gold  based on this view.

However, the breakdown in April 2013 crashed through a level of support that had previously held 3 or 4 times in 2011-2013, i.e. $1520-1540. This time there is not a level of support to compare to this one. In this case, it might be postulated that the $1030 level (the highs from 2008) might be the key psychological level that may fall this time around.

To Rick’ Ackerman’s $817 target by the end of the year perhaps?

The width of the channel as measured when drawn as a falling wedge in previous posts was about $250 at the start and $170 recently. The $250 is about equal to the original April 2013 crash down move ($-270 from $1590 to $1320) so perhaps I could propose the secondary down move might be of the order of $170 from wherever the bottom of the channel is currently. It is not far above $1000 on the curved channel above and a little higher is you draw it as a straight falling wedge (maybe (1050?). It also depends on the time taken for the move. A down move to $1000-$170 or $830 is well within the realms of possibility.

Here are some great articles on Phase III of bear markets on goldtadise.com:

http://goldtadise.com/?p=342366, etc


Here are a couple of charts from those articles (these do not belong to me but they do not show on the above articles at the moment for some reason.) Note the striking similarity between the down-move in the Dow in 1929-32 and gold in 2012-2015. Both bear markets had their middle stage within an inverted parabolic trading channel. In the case of the Dow in 1932, the final plunge was still within that trading channel but this still allowed for a huge drop to the final low. I suspect the same may happen with gold. At present, the channel bottom is at $1000 but I think that will probably match the action in the Dow at the start of 1932 - a sideways to up shallow bounce to follow plus a plunge to $800. I therefore think the recent $1191 high in gold was probably equivalent to the Dow high in Nov 1932 (or perhaps the one in March 1932 if one is to be a little more optimistic). 


Here are a couple of links:

http://rambus1.com/2015/10/31/late-friday-night-charts-28/
BOO!

http://traderdan.com/?p=7722
BOO times TWO!

There was an interesting show on Korelin Economics Report this weekend from the New Orleans Investment Conference:

http://www.kereport.com/2015/10/31/2015-orleans-investment-conference/

This post is mirrored on Golf TA Paradise at 

http://goldtadise.com/?p=355165
"Bearish curves on gold chart from last 2+ years"

with some good user comments underneath.


Tuesday 13 October 2015

Gold breaks out of small falling wedge formation but larger one remains intact.

Gold breaks out of small (9 month) falling wedge formation but larger one 
(2-year+) remains intact:


$1240 would be needed to break out of the larger wedge even by a tiny bit; perhaps one should say $1250 would be needed to make any kind of convincing move out of the wedge to the upside.

Monday 5 October 2015

Modified appropriated chart from Cory's blog post... 2015-10-05.

Here is a modified version of Cory's chart from his Korelin Economics Report blog post at:

http://www.kereport.com/2015/10/05/gold-verge-breakout-higher-etf-holdings-rise/

To me, the chart looks like bear flag city already. Nothing has changed:


Monday 28 September 2015

Fantastic 'super moon' total lunar eclipse last night.

I enjoyed the fantastic 'super moon' total lunar eclipse last night. It was the best one I had ever seen. It was a very long drawn out affair, not as exciting as a total solar eclipse but to me much better than any partial solar eclipse, even a 99% one. I got to see it from the comfort of my own home too!

I had a bit of a photo-fest! Mostly manual exposures on a tripod with a long zoom lens. I also took some camcorder videos but they were a bit grainy.

Equipment:

Camera Canon EOS 1200D entry-level DSLR + 75-300 zoom lens.

Camcorder: Canon Legria HF R57 on program or low light settings but with manual exposure control and focus (mostly).

Velbon and Slik mini-tripods.


All photos (c) me 2015.


Sunday 20 September 2015

$1240+ might suffice as potential to end the gold bear trend.

I am thinking that maybe a move in gold to $1240+ might suffice as potential to end its bear trend at least for a cyclical bull market run:


Monday 14 September 2015

Dow gaps down through its megaphone top line

The Dow has gapped down through its megaphone top line:


My target for the Dow would then be first to go to 5500 then to 1850. If Dow:Gold ratio goes to 1:1 again, which I don’t think it will for years, I think it will most likely be somewhere near the $1800-2000 level.
This perhaps shows the megaphone structure is in play and it has a target around 5500, about a 2/3 decline. On a log chart the bearish target of a breakdown of this megaphone would be another 2/3 decline below the lower blue line to around 1850.
THE NO-WIN FOR GOLDBUGS WOULD BE:
In terms of gold, I wouldn’t rule out a secular bear market until the 2030s. You could have gold at $1850 and Dow at 1850 with no new high for gold. That would be as bad as it could get for goldbugs – to have Dow:Gold at 1:1 and gold still in a bear market!

Tuesday 25 August 2015

Mini crash in general stock markets over the past 5 days.

Here is a chart showing the last 5 days action in the conventional stock market: the S&P 500 as an example.
As I write, the SPX is down for the day 18 points Tuesday and is below Monday afternoon's secondary low but is still above the Monday morning crash low:


and the Dow. Note the gaps both in price and in time on Monday's intraday chart , if you select bar or candlestick charts. Were there some meaningful trading halts then?


Wednesday 29 July 2015

Watch out for my posts on Goldtent TA Paradise!

I have just joined a site called:

Goldtent TA Paradise
FOR PRECIOUS METALS TECHNICAL ANALYSIS ENTHUSIASTS

http://goldtadise.com/

and I would thoroughly recommend it.

I can see as a newbie on this site that there is a great deal of interesting material. I shall be posting a few of my modest missives there.

Right now I am trying to digest "Plunger's" bear market models:

Plunger's pages:
http://plunger.goldtadise.com/

Phase III : Bear Market Models:
http://goldtadise.com/?p=342366

The Three Phases of a Bear Market…The Big Picture:
http://goldtadise.com/?p=342329

They seem to me to suggest a dramatic move down in gold imminently (i.e. the second half of 2015) into the $800s on past form of other bear markets. Some major stocks have broken down quite spectacularly on a similar timeframe (Barrick and Yamana are two good examples).

I also note that the Yen had another flag formation after its breakdown late in 2014 and this also broke down.

http://rambus1.com/wp-content/uploads/2015/03/xjy-day1.png

It doesn't look like the Yen bear market has ended.

Gold is positioned right where the Yen chart was last September (2014), just before the plunge into a new lower trading range. 

The next few weeks are going to be very telling for the precious metals.

Friday 24 July 2015

Falling wedge of gold is similar to recent bearish pattern in Japanese Yen. Targets: $988, $910, $810.

Now I have taken a look at some more examples of falling wedge patterns I note that many examples online have a falling wedge occurring in a longer term uptrend and then they interpret the pattern as bullish, so it becomes a continuation pattern in a sense in terms of the overall trend. Most sites always see a falling wedge as bullish.

The present gold falling wedge comes after a general downmove, so does that make it more likely to have a bearish outcome or not?

Looking at Google images I can find very few examples of bearish outcomes from falling wedges but one is particularly interesting and it comes from Rambus chartology:

http://rambus1.com/wp-content/uploads/2015/03/xjy-day1.png

Before I clicked on the above linked image, I guessed that pattern might be an early 1980s or mid-1980s gold chart but it was the Yen from 2013 to 2015 which has been positively correlated with the falls in gold but has already broken aggressively to the downside. Gold may be in the process of following perhaps?

The gold pattern for 2013-2015 is similar and the falling wedge contains three pennants, both of which have gone to the downside.

http://stockcharts.com/freecharts/gallery.html?s=$gold

Annotating it here:


The Yen has been well correlated to gold for 3-4 years. Visually the correlation was quite stunning in the mid 2014 timeframe and the April 2013 crash in gold was preceded by t good downmove in the yen and the two bear markets started at roughly the same time on Abenomics in September 2012.


Usually gold has followed the Yen main down-moves within a few weeks but late in 2014, gold did not crash as the Yen did; it held in its trading channel and made the new low at $1130. It is fascinating to see whether gold will follow the Yen and Barrick down to new lows.


It does not look gold for gold based on this analysis.

Possible target from breakdown on pennant number 3 using $1135 and $1308 as starting prices and $1160 as the apex of is pennant:

$1160-($1307-$1135)=$988 gold.

If the channel doubles its current width and breaks to the downside the target is $1080-$170 or $910  (the channel is $170 in height).

However if you take the original width of the channel it was $250-270 deep:

$1080-270 = $810 which reaches Rick Ackerman's bearish $817 target neatly, given many timerecently on the Korelin Economics Report and based on an ABCD pattern starting in September 2012.

I could use the same interval of the summer rally ($1180-$1434) in mid-2013 as the starting channel width for the ensuing (bearish?) falling wedge i.e. $254, though as always it depends where you take the measurements. If the channel floor is at $1080 and it falls out of bed, the target would be around $826.

If gold bounces here and fails to get to the channel top at around $1250 then watch out below afterwards. Gold needs to get above $1250 to break out to the upside.

Looking at gold stock charts, some have already broken down convincingly as per the Yen: Barrick and Yamana for instance - somewhat spectacularly!

Thursday 23 July 2015

Will the downtrend channel of gold hold or break to downside?

Good question: Will the downtrend channel of gold hold or break to the downside?

Who knows? $1080 could have been forecasted as the channel floor for mid-2015 as far back as the turn of this year.


The downtrend channel in gold since late 2013 has narrowed from around 
$250 in 2013 to $170 now. It's barely a falling wedge - it's just a falling channel!

The channel ceiling is at about $1250 and the floor is at $1080, so stepping down that channel would give a new range from $910 to $1080. If it takes a little time to get to the $910 target, then it could go lower because the channel is downsloping.

1080-(1250-1080)=910.


So, $890 is well in the sights if the current trend channel breaks down and if a new lower trading range persists parallel to this one, sloping at about $50 every 6 months, Rick Ackerman's $817 target could be reached in under a year.

http://www.kereport.com/2015/07/20/rick-real-irony-markets-today-conventional-markets-correct-inevitable-gold-hold/

http://www.kereport.com/2015/07/20/doctor-commenting-drop-price-gold/


Wednesday 22 July 2015

Considering position of gold now - hanging on to 1000 EUR, 700 GBP or $US 1100 by a thread?

Considering the position of gold now - hanging on to 1000 EUR, 700 GBP or $US 1100 by a thread?

Today is a moment of truth in the gold market, whether the slowly downtrending trading channel of the last 18 months can hold (currently the range is about $1100-1300) or whether gold is going to break down into a new lower range from $900-1100. $1080 is a good point for a bounce as described in the previous post so there had 'better be one' - or else!

http://1000gold.blogspot.co.uk/2015/07/gold-target-under-1100-easy-forecast-5.html

Gold has been trashed in terms of US dollars, Pounds Sterling, Swiss Francs and even the troubled Euro and Yen.

Looking at charts from this previous article, where does this market stand for the longer term? On the edge of a cliff possibly or perhaps near the lows:

http://1000gold.blogspot.co.uk/2015/02/essay-on-gold-comparing-current.html

The three scenarios are still possible, extended secular bear market (red), new upleg to new highs (blue) and middling scenario (green). The goldbug promoters never talk about the red scenario, a 19-year bear market as per 1980-1999!


Looking at this now slightly dated chart, the latest move to $1080 is well in line with the pace of the downtrend in force since mid-2013 and would be nothing to worry about unless this range were to break down, in which case a move under $900 could be well in play. The worst I could see on this chart was $780 at the time but I was sort of favouring a gradual downtrend and then a slow upturn as in he period 1998-2001 (see left of chart below):


As usual, the goldbug websites continue to huff and puff all the same old bull that they have shoved down people's throats in the past several years as they sucked all the suckers in at the top and kept them invested all the way down.

It's about time that people turned away from these shysters and did their own due diligence as well as looking at some balanced analysis.


Monday 20 July 2015

Gold target under 1100 easy forecast 5 months ago.

Here was a chart from February 2015 that gives the US dollar price of gold (ignore the blue Euro gold  line for this one). There was quite a plain downtrend channel in US dollar priced gold. A break below the channel occurred late in 2014 taking gold to $1130. So it was a simple matter to add a line from there following the channel slope and take gold under 1100 at a later date:


That date has arrived on 20 July 2015, 46 years after Neil Armstrong stepped onto the Moon's surface and on this anniversary day, gold has plunged to $1080 in early hours trading in Asia. Could $1080 is another low in the series, $1180, $1130, $1080, (etc.) with $50 downmoves in the highs and lows that have been going on about every 6 months for ages now. (The highs have been $1434, $1393, $1347 and $1308. Maybe later this year could see a bounce to around $1260, then?


However, today's price action now puts gold well below the $1125 key hidden pivot level from Rick Ackerman's analysis that could take it as low as $817 in the future.

http://www.kereport.com/2015/07/17/rick-1125-support-target-gold-breached-trouble/

Of course, the $1080 drop could be a flush type move to trick speculators into going short and then flush them out., It will be interesting to see where the price settles but it has better settle above $1125!

Rick's $817 target but it comes from the ABCD pattern with A at $1800 Sept 2012, B at $1180 June 2013, C at $1434 Aug 2013 and D at $814 whenever. AB equals CD. The hidden pivot is point P halfway between C and D at $1124 in this case. $1124 support is crucial and has now broken down so the $814 target is in play.

This is Rick's hidden pivot and comes from the Trident Trading method if I am not mistaken.

I am not sure if such a  target would be reached but things do not look good in any case.


Saturday 25 April 2015

Possible gold action over the next few years.

Fiddling around with a chart from www.Kitco.com, I got this:


Tuesday 10 March 2015

The DAX has risen today while the FTSE 100 and Dow have been clobbered.


It’s interesting that the German DAX is up at the moment for today while the FTSE100 and the Dow are down heavily.
Currency depreciation in the Euro zone is making Germany very competitive indeed I would guess.
The UK doesn't produce anything much, so it is well into a permanent trade deficit, especially now UK oil production is in decline.
So even though the pound is down today, the FTSE is not going up; it has tanked today.
I have a sneaky feeling that the Germans are happy to string the Greek issue along and keep kicking the can while the Euro depreciates so they can compete with Japan, one of their major trade rivals in many areas, perhaps their number 1 trade rival that has trashed its currency since late 2012.
BMWs vs Toyotas, Mercedes vs Lexus, BMW motorbikes, vs Honda, etc.

I also added the Nikkei a day later and there was a little but not much negative action there.
These daily charts are from the excellent www.stockcharts.com Gallery views:


Monday 9 March 2015

US Dollar bull markets - how long do they last?

I did a little research into the following  question: 

US Dollar bull markets - how long do they last?

Now we are in the zone of all the US dollar top callers who only a year ago were saying that the dollar bear market was going to restart while the dollar was under 80. Now it is 97 and they are already calling the top.

I thought that I would look at the long term US dollar chart here (10th chart from the top):

http://stockcharts.com/freecharts/historical/marketindexes.html

I have edited is as follows:

How wide are the bull markets? I looked at the width of these bull market peaks that occurred around 1985 and 2001. How long is it from the breakout to the time when the dollar index came down again to that level?

From the start of the breakout n(green circles), the peak widths were 5.7 and 6.7 years. This time the dollar broke out in mid-2014 at 80+ on the index, so one might expect that 80 level to remain exceeded until at least the start of 2020 and it may be early 2021.

I also looked at the width at half height of the peaks in the dollar which is a common thing to do in science.

This place halfway up the peak is during the second major leg up in the dollar in each bull market after there had already been a post breakout correction and a second breakout (purple circles). The widths here were 2.2 and 2.9 years. That would take us at least from now until mid-2017 until we even get down to where we are today at 95+. However we haven't even had a correction in this uptrend yet.

How long was it from the breakout in the dollar index to the peak in the last two dollar bull markets?

Well in 1985 it was 3.9 years and in 2001 it was 4.9 years. So starting in mid-2014 the next dollar peak might be expected between early 2018 to early 2019.

The distance from halfway up the bull market to the top in each case was 1.7-2.2 years. If we are halfway up the present USDX bull market right now (which is debatable), the peak could be expected in late 2016 to early 2017.

The breakout in this dollar bull is much stronger than in the 1992-2001 bull and much more like the 1980-1985 bull, which coicidentally was also accompanied by a sustained rise in US oil production and fall in oil imports. This time the USDX has also rocketed through the top line of a huge falling wedge.

Looking at these charts, historic precedent suggest a dollar top between late 2016 and early 2019. This is also in the zone of a potential peak in shale oil production. It also sugests that it will be between mid-2017 and early 2021 before the dollar bull market is well on its way down.

There is plenty of room time wise for the dollar to continue its increase given past performance.


Tuesday 3 March 2015

Gold hit $1195 at the bottom of its uptrend channel this morning

Gold hit $1195 at the bottom of its uptrend channel this morning. It seems to be weakening within the uptrend and the trend itself is pretty shallow. It's a long way from the top of the recent little uptrend which would b at $1232.


The top of the now forgotten uptrend in force since November 2014 would be at about $1340, just short of the $1347 high of late Summer 2014.

Longer term there are several possibilities. This is a real turning point right now:


Sunday 1 March 2015

Gold has popped up to $1220 overnight on Sunday into Monday - $1223 is an important level!

Gold has popped up to $1220 overnight on Sunday/Monday morning as of 0200 Greenwich mean Time after holding support near to $1210 at last last Friday's close (see previous post). Resistance has held on the upsloping line where the price is touching at about $1220. Can it break through?


This was the position on Friday evening a little before the close and the price held at around $1210 and then bounced early Monday morning:


Gold has reached $1223, above the level of the first upsloping resistance line but level with some horizontal resistance at 1223.40 and price has pulled back a bit after this strong early overnight move:


In fact, $1223 has been an important level of resistance and support since September 2014. Of course, it was also the level of the price peak in late 2009! I have also added three purple lines on the right hand side that may be a potential Andrews Pitchfork parallel to the existing slope:


Friday 27 February 2015

Potential channel for new gold bull market?

I have drawn a potential trend channel for new gold bull market as shown on the upper, long term chart. It is very much with a question mark but in the last few days gold has rolled to the upside from its recent downtrend (from January to mid-February 2015) as shown on the lower chart.

Much too early to call - but maybe there is potential if the long term support blue line holds.


If this blue line does not hold then there will be trouble for gold bulls because it is a line set by the most important low in the 2001-2011 bull market, that of $680 in late 2008. The blue line is an important line in the sand but the sideways to down action of the last year or so slices down through that blue line about now. One perhaps not really expect it to hold unless some upside momentum comes into this market quickly.

To look decent, gold needs to close above about $1208-1210 tonight - it is pulling back right now and is at about $1213. I fancy a possible move down to $730 if it does not hold.


Wednesday 25 February 2015

Gold price has bounced exactly on the blue line at $1202

Gold price has bounced exactly on the blue line at $1202. The bulls need this to hold, then there is kind of an inverse head and shoulders going on at that line:


Gold - another chance today to hold at $1200. 25 Feb 2015 18:43 GMT (UK time)

Gold  has another chance to hold at its $1200 support line right now.

It was below this support yesterday now it is above it, only just!


Slightly later 22:11 GMT price has bounced exactly on the blue line. Need it to hold for the bulls:


Tuesday 24 February 2015

Progress of gold chart: not good but not awful (yet)!

Here is this evening's gold chart. Things do not look good but not yet completely awful. 


  • The blue line as the base of the previous uptrend is now acting as resistance. 
  • Gold is still within the recent downtrend channel. 
  • The channel floor is at about $1182.
  • The top of the channel is at $1219

Not inspiring, unless gold gets above the blue line. Really it needs to break out of the downtrend channel by going to about $1220 on the upside but there are now some obstacles in the way


Gary Wagner's line in the sand described in his spot on Kitco, delineating the downside limit to stay out of the previous long term downtrend (from Sept 2012) is here. Ignore my own steeper downtrend channel that marked the 2012-2013 action). His line was at $1198 but it will move down as time goes by. Gold is right at the green line now on the very long term chart:


The recent rally has now been retraced more than 62% and the price is also below the blue line: