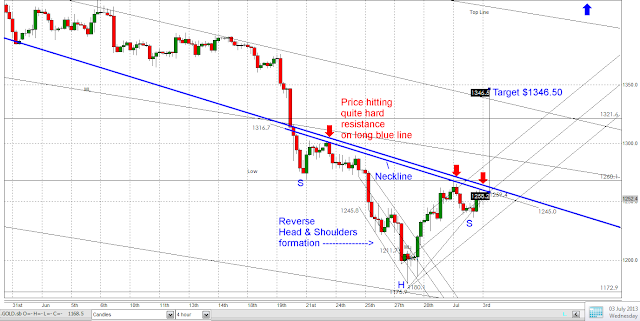
Rick Ackerman on Korelin Economics Report today says he sees a possible rally to $1320 area.
I similarly see a possible rally but only on a breakthrough of the key blue resistance line that has operated for most of the last 2.5 months.
There might be a new short term sideways trend channel forming:
In context, the resistance line is the sloping yellow line on this chart. The reverse Head & Shoulders is the lieelt feature to the lower right. This resistance line has been in force since April 15th (although it was broken to the upside for a little while in June). It also forms part of the bearish flag pattern that broke down, so it is an important resistance line:


No comments:
Post a Comment