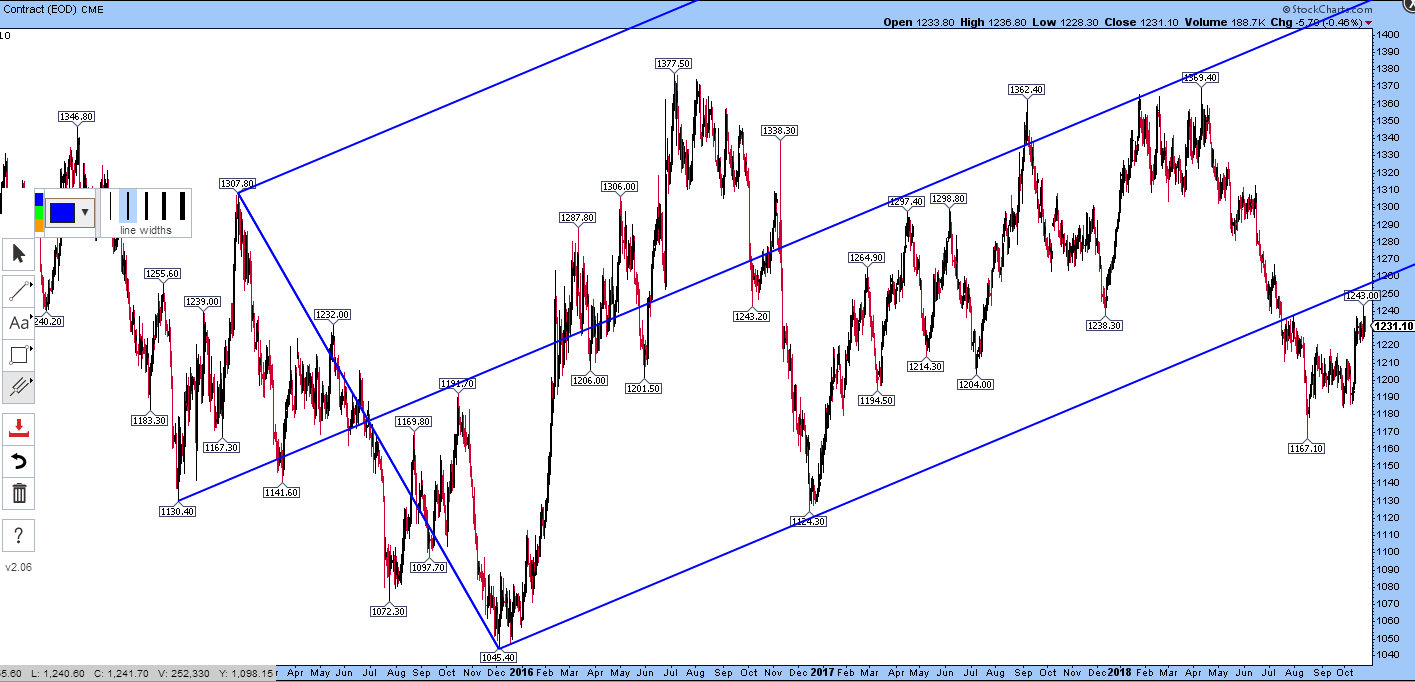
It's always difficult to nail these patterns exactly, since it depends if you take daily or weekly charts and if you take intraday or closing prices as the pivot points.
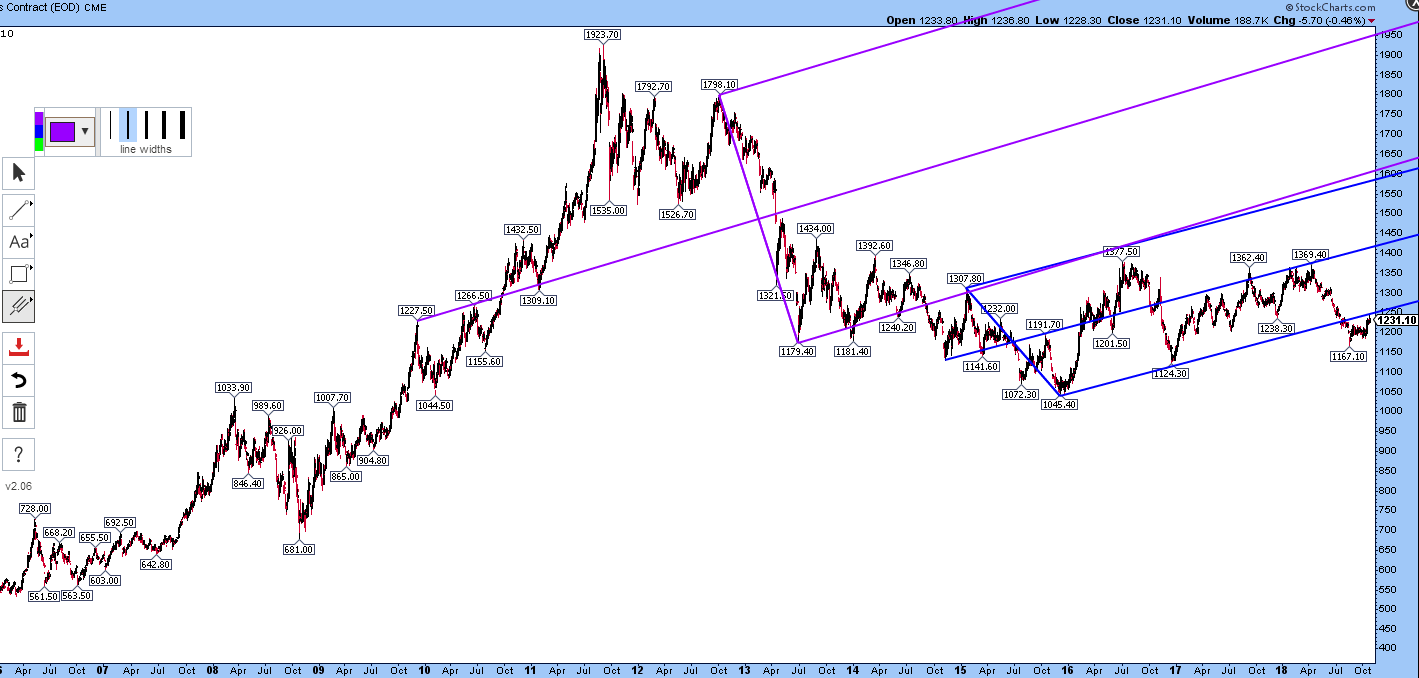
The weekly chart says the high might already be in:
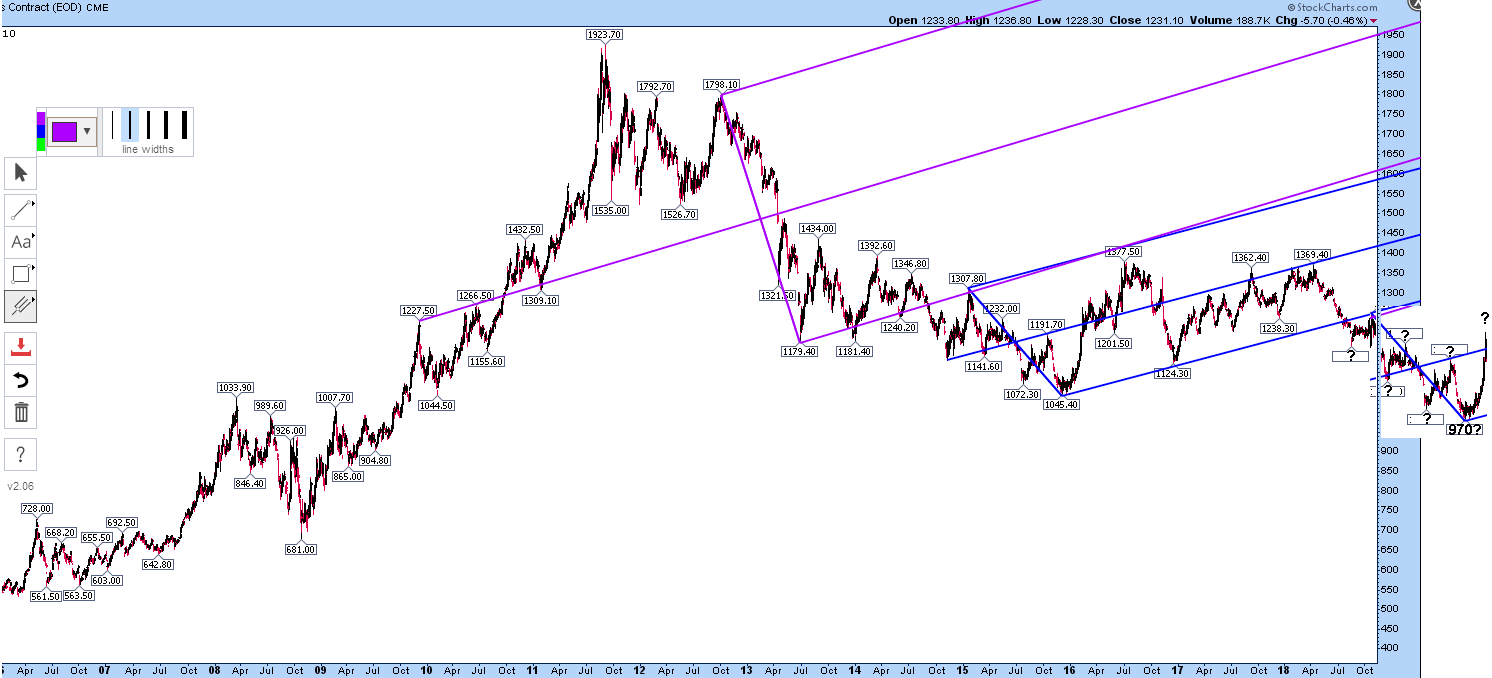
A little mischief with the above chart might suggest a $970-980 target:
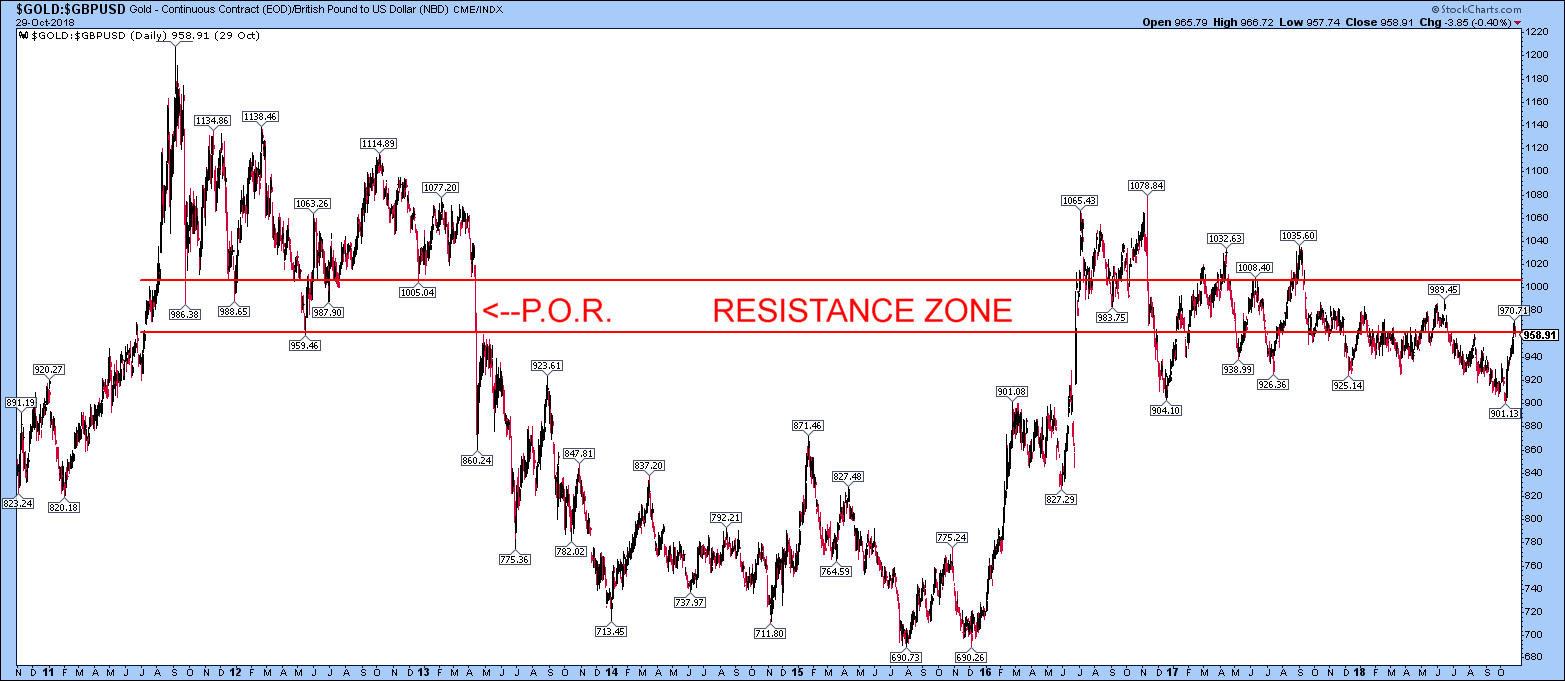
Meanwhile, back at the ranch, gold in GBP (pounds) has just nudged to or into the resistance zone above 960; another back-test perhaps? Coincidence?
1 comment:
really informative blog, thanks for sharing this kind of information. We also have a website where you can get cash for gold by best and top gold buyer
Cash for Gold
Post a Comment