Wednesday 29 July 2015

Watch out for my posts on Goldtent TA Paradise!

I have just joined a site called:

Goldtent TA Paradise
FOR PRECIOUS METALS TECHNICAL ANALYSIS ENTHUSIASTS

http://goldtadise.com/

and I would thoroughly recommend it.

I can see as a newbie on this site that there is a great deal of interesting material. I shall be posting a few of my modest missives there.

Right now I am trying to digest "Plunger's" bear market models:

Plunger's pages:
http://plunger.goldtadise.com/

Phase III : Bear Market Models:
http://goldtadise.com/?p=342366

The Three Phases of a Bear Market…The Big Picture:
http://goldtadise.com/?p=342329

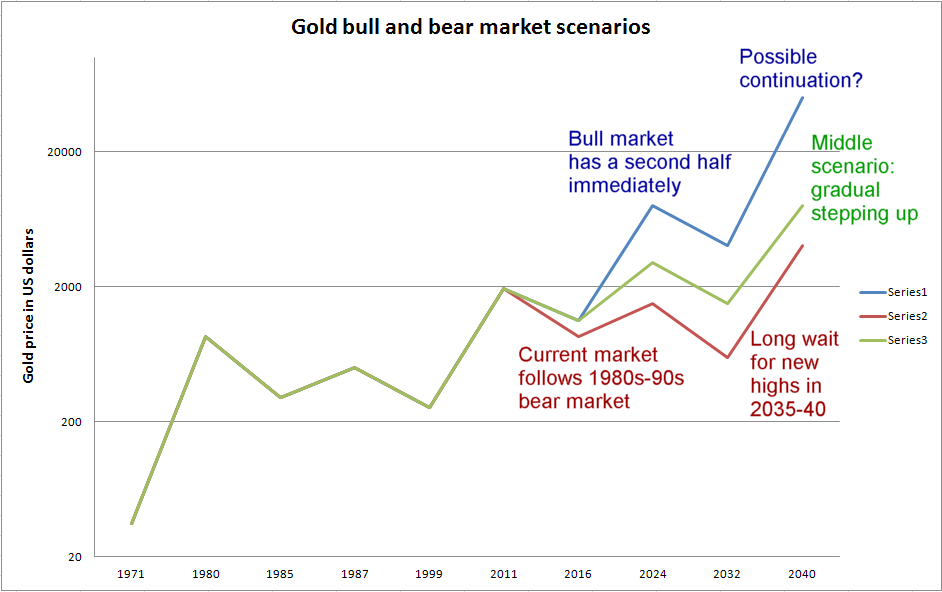
They seem to me to suggest a dramatic move down in gold imminently (i.e. the second half of 2015) into the $800s on past form of other bear markets. Some major stocks have broken down quite spectacularly on a similar timeframe (Barrick and Yamana are two good examples).

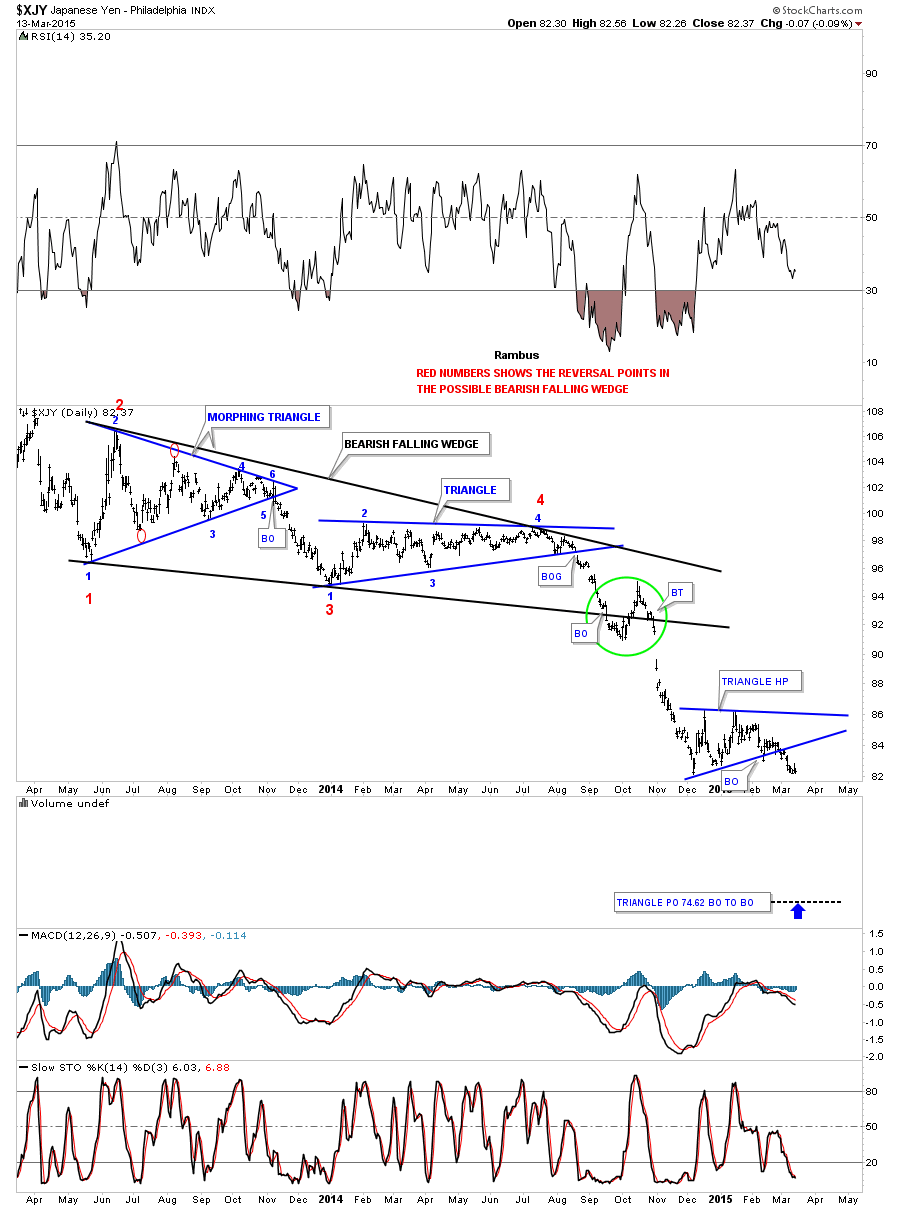
I also note that the Yen had another flag formation after its breakdown late in 2014 and this also broke down.

http://rambus1.com/wp-content/uploads/2015/03/xjy-day1.png

It doesn't look like the Yen bear market has ended.

Gold is positioned right where the Yen chart was last September (2014), just before the plunge into a new lower trading range. 

The next few weeks are going to be very telling for the precious metals.

Friday 24 July 2015

Falling wedge of gold is similar to recent bearish pattern in Japanese Yen. Targets: $988, $910, $810.

Now I have taken a look at some more examples of falling wedge patterns I note that many examples online have a falling wedge occurring in a longer term uptrend and then they interpret the pattern as bullish, so it becomes a continuation pattern in a sense in terms of the overall trend. Most sites always see a falling wedge as bullish.

The present gold falling wedge comes after a general downmove, so does that make it more likely to have a bearish outcome or not?

Looking at Google images I can find very few examples of bearish outcomes from falling wedges but one is particularly interesting and it comes from Rambus chartology:

http://rambus1.com/wp-content/uploads/2015/03/xjy-day1.png

Before I clicked on the above linked image, I guessed that pattern might be an early 1980s or mid-1980s gold chart but it was the Yen from 2013 to 2015 which has been positively correlated with the falls in gold but has already broken aggressively to the downside. Gold may be in the process of following perhaps?

The gold pattern for 2013-2015 is similar and the falling wedge contains three pennants, both of which have gone to the downside.

http://stockcharts.com/freecharts/gallery.html?s=$gold

Annotating it here:


The Yen has been well correlated to gold for 3-4 years. Visually the correlation was quite stunning in the mid 2014 timeframe and the April 2013 crash in gold was preceded by t good downmove in the yen and the two bear markets started at roughly the same time on Abenomics in September 2012.


Usually gold has followed the Yen main down-moves within a few weeks but late in 2014, gold did not crash as the Yen did; it held in its trading channel and made the new low at $1130. It is fascinating to see whether gold will follow the Yen and Barrick down to new lows.


It does not look gold for gold based on this analysis.

Possible target from breakdown on pennant number 3 using $1135 and $1308 as starting prices and $1160 as the apex of is pennant:

$1160-($1307-$1135)=$988 gold.

If the channel doubles its current width and breaks to the downside the target is $1080-$170 or $910  (the channel is $170 in height).

However if you take the original width of the channel it was $250-270 deep:

$1080-270 = $810 which reaches Rick Ackerman's bearish $817 target neatly, given many timerecently on the Korelin Economics Report and based on an ABCD pattern starting in September 2012.

I could use the same interval of the summer rally ($1180-$1434) in mid-2013 as the starting channel width for the ensuing (bearish?) falling wedge i.e. $254, though as always it depends where you take the measurements. If the channel floor is at $1080 and it falls out of bed, the target would be around $826.

If gold bounces here and fails to get to the channel top at around $1250 then watch out below afterwards. Gold needs to get above $1250 to break out to the upside.

Looking at gold stock charts, some have already broken down convincingly as per the Yen: Barrick and Yamana for instance - somewhat spectacularly!

Thursday 23 July 2015

Will the downtrend channel of gold hold or break to downside?

Good question: Will the downtrend channel of gold hold or break to the downside?

Who knows? $1080 could have been forecasted as the channel floor for mid-2015 as far back as the turn of this year.


The downtrend channel in gold since late 2013 has narrowed from around 
$250 in 2013 to $170 now. It's barely a falling wedge - it's just a falling channel!

The channel ceiling is at about $1250 and the floor is at $1080, so stepping down that channel would give a new range from $910 to $1080. If it takes a little time to get to the $910 target, then it could go lower because the channel is downsloping.

1080-(1250-1080)=910.


So, $890 is well in the sights if the current trend channel breaks down and if a new lower trading range persists parallel to this one, sloping at about $50 every 6 months, Rick Ackerman's $817 target could be reached in under a year.

http://www.kereport.com/2015/07/20/rick-real-irony-markets-today-conventional-markets-correct-inevitable-gold-hold/

http://www.kereport.com/2015/07/20/doctor-commenting-drop-price-gold/


Wednesday 22 July 2015

Considering position of gold now - hanging on to 1000 EUR, 700 GBP or $US 1100 by a thread?

Considering the position of gold now - hanging on to 1000 EUR, 700 GBP or $US 1100 by a thread?

Today is a moment of truth in the gold market, whether the slowly downtrending trading channel of the last 18 months can hold (currently the range is about $1100-1300) or whether gold is going to break down into a new lower range from $900-1100. $1080 is a good point for a bounce as described in the previous post so there had 'better be one' - or else!

http://1000gold.blogspot.co.uk/2015/07/gold-target-under-1100-easy-forecast-5.html

Gold has been trashed in terms of US dollars, Pounds Sterling, Swiss Francs and even the troubled Euro and Yen.

Looking at charts from this previous article, where does this market stand for the longer term? On the edge of a cliff possibly or perhaps near the lows:

http://1000gold.blogspot.co.uk/2015/02/essay-on-gold-comparing-current.html

The three scenarios are still possible, extended secular bear market (red), new upleg to new highs (blue) and middling scenario (green). The goldbug promoters never talk about the red scenario, a 19-year bear market as per 1980-1999!


Looking at this now slightly dated chart, the latest move to $1080 is well in line with the pace of the downtrend in force since mid-2013 and would be nothing to worry about unless this range were to break down, in which case a move under $900 could be well in play. The worst I could see on this chart was $780 at the time but I was sort of favouring a gradual downtrend and then a slow upturn as in he period 1998-2001 (see left of chart below):


As usual, the goldbug websites continue to huff and puff all the same old bull that they have shoved down people's throats in the past several years as they sucked all the suckers in at the top and kept them invested all the way down.

It's about time that people turned away from these shysters and did their own due diligence as well as looking at some balanced analysis.


Monday 20 July 2015

Gold target under 1100 easy forecast 5 months ago.

Here was a chart from February 2015 that gives the US dollar price of gold (ignore the blue Euro gold  line for this one). There was quite a plain downtrend channel in US dollar priced gold. A break below the channel occurred late in 2014 taking gold to $1130. So it was a simple matter to add a line from there following the channel slope and take gold under 1100 at a later date:


That date has arrived on 20 July 2015, 46 years after Neil Armstrong stepped onto the Moon's surface and on this anniversary day, gold has plunged to $1080 in early hours trading in Asia. Could $1080 is another low in the series, $1180, $1130, $1080, (etc.) with $50 downmoves in the highs and lows that have been going on about every 6 months for ages now. (The highs have been $1434, $1393, $1347 and $1308. Maybe later this year could see a bounce to around $1260, then?


However, today's price action now puts gold well below the $1125 key hidden pivot level from Rick Ackerman's analysis that could take it as low as $817 in the future.

http://www.kereport.com/2015/07/17/rick-1125-support-target-gold-breached-trouble/

Of course, the $1080 drop could be a flush type move to trick speculators into going short and then flush them out., It will be interesting to see where the price settles but it has better settle above $1125!

Rick's $817 target but it comes from the ABCD pattern with A at $1800 Sept 2012, B at $1180 June 2013, C at $1434 Aug 2013 and D at $814 whenever. AB equals CD. The hidden pivot is point P halfway between C and D at $1124 in this case. $1124 support is crucial and has now broken down so the $814 target is in play.

This is Rick's hidden pivot and comes from the Trident Trading method if I am not mistaken.

I am not sure if such a  target would be reached but things do not look good in any case.