Monday, 28 September 2015

Fantastic 'super moon' total lunar eclipse last night.

I enjoyed the fantastic 'super moon' total lunar eclipse last night. It was the best one I had ever seen. It was a very long drawn out affair, not as exciting as a total solar eclipse but to me much better than any partial solar eclipse, even a 99% one. I got to see it from the comfort of my own home too!

I had a bit of a photo-fest! Mostly manual exposures on a tripod with a long zoom lens. I also took some camcorder videos but they were a bit grainy.

Equipment:

Camera Canon EOS 1200D entry-level DSLR + 75-300 zoom lens.

Camcorder: Canon Legria HF R57 on program or low light settings but with manual exposure control and focus (mostly).

Velbon and Slik mini-tripods.


All photos (c) me 2015.


Sunday, 20 September 2015

$1240+ might suffice as potential to end the gold bear trend.

I am thinking that maybe a move in gold to $1240+ might suffice as potential to end its bear trend at least for a cyclical bull market run:


Monday, 14 September 2015

Dow gaps down through its megaphone top line

The Dow has gapped down through its megaphone top line:


My target for the Dow would then be first to go to 5500 then to 1850. If Dow:Gold ratio goes to 1:1 again, which I don’t think it will for years, I think it will most likely be somewhere near the $1800-2000 level.
This perhaps shows the megaphone structure is in play and it has a target around 5500, about a 2/3 decline. On a log chart the bearish target of a breakdown of this megaphone would be another 2/3 decline below the lower blue line to around 1850.
THE NO-WIN FOR GOLDBUGS WOULD BE:
In terms of gold, I wouldn’t rule out a secular bear market until the 2030s. You could have gold at $1850 and Dow at 1850 with no new high for gold. That would be as bad as it could get for goldbugs – to have Dow:Gold at 1:1 and gold still in a bear market!

Tuesday, 25 August 2015

Mini crash in general stock markets over the past 5 days.

Here is a chart showing the last 5 days action in the conventional stock market: the S&P 500 as an example.
As I write, the SPX is down for the day 18 points Tuesday and is below Monday afternoon's secondary low but is still above the Monday morning crash low:


and the Dow. Note the gaps both in price and in time on Monday's intraday chart , if you select bar or candlestick charts. Were there some meaningful trading halts then?


Wednesday, 29 July 2015

Watch out for my posts on Goldtent TA Paradise!

I have just joined a site called:

Goldtent TA Paradise
FOR PRECIOUS METALS TECHNICAL ANALYSIS ENTHUSIASTS

http://goldtadise.com/

and I would thoroughly recommend it.

I can see as a newbie on this site that there is a great deal of interesting material. I shall be posting a few of my modest missives there.

Right now I am trying to digest "Plunger's" bear market models:

Plunger's pages:
http://plunger.goldtadise.com/

Phase III : Bear Market Models:
http://goldtadise.com/?p=342366

The Three Phases of a Bear Market…The Big Picture:
http://goldtadise.com/?p=342329

They seem to me to suggest a dramatic move down in gold imminently (i.e. the second half of 2015) into the $800s on past form of other bear markets. Some major stocks have broken down quite spectacularly on a similar timeframe (Barrick and Yamana are two good examples).

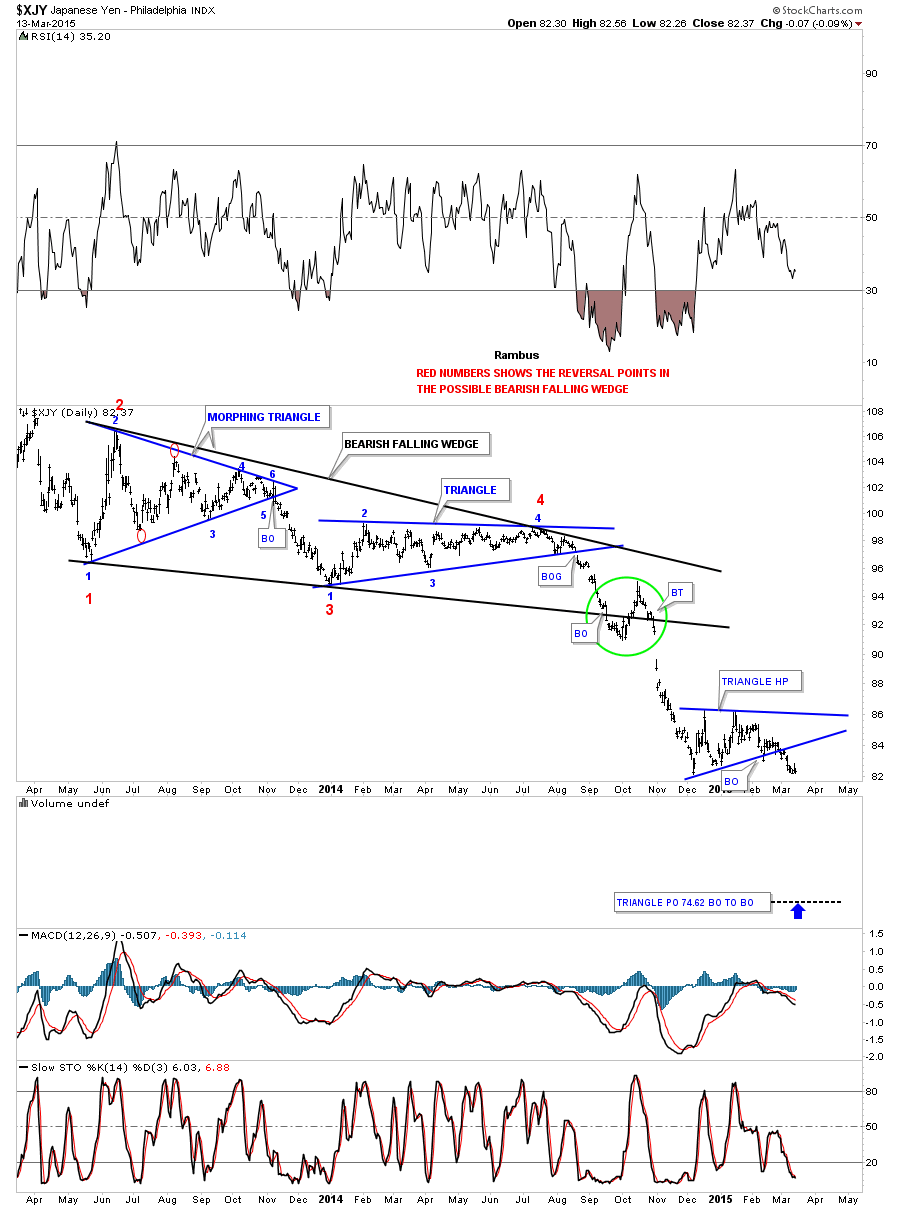
I also note that the Yen had another flag formation after its breakdown late in 2014 and this also broke down.

http://rambus1.com/wp-content/uploads/2015/03/xjy-day1.png

It doesn't look like the Yen bear market has ended.

Gold is positioned right where the Yen chart was last September (2014), just before the plunge into a new lower trading range. 

The next few weeks are going to be very telling for the precious metals.

Friday, 24 July 2015

Falling wedge of gold is similar to recent bearish pattern in Japanese Yen. Targets: $988, $910, $810.

Now I have taken a look at some more examples of falling wedge patterns I note that many examples online have a falling wedge occurring in a longer term uptrend and then they interpret the pattern as bullish, so it becomes a continuation pattern in a sense in terms of the overall trend. Most sites always see a falling wedge as bullish.

The present gold falling wedge comes after a general downmove, so does that make it more likely to have a bearish outcome or not?

Looking at Google images I can find very few examples of bearish outcomes from falling wedges but one is particularly interesting and it comes from Rambus chartology:

http://rambus1.com/wp-content/uploads/2015/03/xjy-day1.png

Before I clicked on the above linked image, I guessed that pattern might be an early 1980s or mid-1980s gold chart but it was the Yen from 2013 to 2015 which has been positively correlated with the falls in gold but has already broken aggressively to the downside. Gold may be in the process of following perhaps?

The gold pattern for 2013-2015 is similar and the falling wedge contains three pennants, both of which have gone to the downside.

http://stockcharts.com/freecharts/gallery.html?s=$gold

Annotating it here:


The Yen has been well correlated to gold for 3-4 years. Visually the correlation was quite stunning in the mid 2014 timeframe and the April 2013 crash in gold was preceded by t good downmove in the yen and the two bear markets started at roughly the same time on Abenomics in September 2012.


Usually gold has followed the Yen main down-moves within a few weeks but late in 2014, gold did not crash as the Yen did; it held in its trading channel and made the new low at $1130. It is fascinating to see whether gold will follow the Yen and Barrick down to new lows.


It does not look gold for gold based on this analysis.

Possible target from breakdown on pennant number 3 using $1135 and $1308 as starting prices and $1160 as the apex of is pennant:

$1160-($1307-$1135)=$988 gold.

If the channel doubles its current width and breaks to the downside the target is $1080-$170 or $910  (the channel is $170 in height).

However if you take the original width of the channel it was $250-270 deep:

$1080-270 = $810 which reaches Rick Ackerman's bearish $817 target neatly, given many timerecently on the Korelin Economics Report and based on an ABCD pattern starting in September 2012.

I could use the same interval of the summer rally ($1180-$1434) in mid-2013 as the starting channel width for the ensuing (bearish?) falling wedge i.e. $254, though as always it depends where you take the measurements. If the channel floor is at $1080 and it falls out of bed, the target would be around $826.

If gold bounces here and fails to get to the channel top at around $1250 then watch out below afterwards. Gold needs to get above $1250 to break out to the upside.

Looking at gold stock charts, some have already broken down convincingly as per the Yen: Barrick and Yamana for instance - somewhat spectacularly!

Thursday, 23 July 2015

Will the downtrend channel of gold hold or break to downside?

Good question: Will the downtrend channel of gold hold or break to the downside?

Who knows? $1080 could have been forecasted as the channel floor for mid-2015 as far back as the turn of this year.


The downtrend channel in gold since late 2013 has narrowed from around 
$250 in 2013 to $170 now. It's barely a falling wedge - it's just a falling channel!

The channel ceiling is at about $1250 and the floor is at $1080, so stepping down that channel would give a new range from $910 to $1080. If it takes a little time to get to the $910 target, then it could go lower because the channel is downsloping.

1080-(1250-1080)=910.


So, $890 is well in the sights if the current trend channel breaks down and if a new lower trading range persists parallel to this one, sloping at about $50 every 6 months, Rick Ackerman's $817 target could be reached in under a year.

http://www.kereport.com/2015/07/20/rick-real-irony-markets-today-conventional-markets-correct-inevitable-gold-hold/

http://www.kereport.com/2015/07/20/doctor-commenting-drop-price-gold/