I have drawn a potential trend channel for new gold bull market as shown on the upper, long term chart. It is very much with a question mark but in the last few days gold has rolled to the upside from its recent downtrend (from January to mid-February 2015) as shown on the lower chart.
Much too early to call - but maybe there is potential if the long term support blue line holds.
If this blue line does not hold then there will be trouble for gold bulls because it is a line set by the most important low in the 2001-2011 bull market, that of $680 in late 2008. The blue line is an important line in the sand but the sideways to down action of the last year or so slices down through that blue line about now. One perhaps not really expect it to hold unless some upside momentum comes into this market quickly.
To look decent, gold needs to close above about $1208-1210 tonight - it is pulling back right now and is at about $1213. I fancy a possible move down to $730 if it does not hold.
Friday, 27 February 2015
Wednesday, 25 February 2015
Gold price has bounced exactly on the blue line at $1202
Gold price has bounced exactly on the blue line at $1202. The bulls need this to hold, then there is kind of an inverse head and shoulders going on at that line:
Gold - another chance today to hold at $1200. 25 Feb 2015 18:43 GMT (UK time)
Gold has another chance to hold at its $1200 support line right now.
It was below this support yesterday now it is above it, only just!
Tuesday, 24 February 2015
Progress of gold chart: not good but not awful (yet)!
Here is this evening's gold chart. Things do not look good but not yet completely awful.
Not inspiring, unless gold gets above the blue line. Really it needs to break out of the downtrend channel by going to about $1220 on the upside but there are now some obstacles in the way
Gary Wagner's line in the sand described in his spot on Kitco, delineating the downside limit to stay out of the previous long term downtrend (from Sept 2012) is here. Ignore my own steeper downtrend channel that marked the 2012-2013 action). His line was at $1198 but it will move down as time goes by. Gold is right at the green line now on the very long term chart:
The recent rally has now been retraced more than 62% and the price is also below the blue line:
- The blue line as the base of the previous uptrend is now acting as resistance.
- Gold is still within the recent downtrend channel.
- The channel floor is at about $1182.
- The top of the channel is at $1219
Not inspiring, unless gold gets above the blue line. Really it needs to break out of the downtrend channel by going to about $1220 on the upside but there are now some obstacles in the way
Gary Wagner's line in the sand described in his spot on Kitco, delineating the downside limit to stay out of the previous long term downtrend (from Sept 2012) is here. Ignore my own steeper downtrend channel that marked the 2012-2013 action). His line was at $1198 but it will move down as time goes by. Gold is right at the green line now on the very long term chart:
The recent rally has now been retraced more than 62% and the price is also below the blue line:
Monday, 23 February 2015
Fractals in action - uncanny similarity between today's 1 minute chart and the 240 min chart since last October!
Fractals in action: note the uncanny similarity between today's 1 minute chart and the 240 min chart since last October!
For self-similarity at different scales, this is a great example. The self-similarity at this point extends even to the fact that both support lines were in the process of breaking down as this screenshot was taken:
I am adding to this post on 24 February 2015. The biggest fractal of all is the entire gold bull market, see below and how similar it is to the two timescales above: all at a key level and all breaking down a little:
For self-similarity at different scales, this is a great example. The self-similarity at this point extends even to the fact that both support lines were in the process of breaking down as this screenshot was taken:
I am adding to this post on 24 February 2015. The biggest fractal of all is the entire gold bull market, see below and how similar it is to the two timescales above: all at a key level and all breaking down a little:
Saturday, 21 February 2015
Mike Shedlock (Mish) made good comments on a Howe Street podcast about Greece and the Eurozone.
I was interested to hear Mike Shedlock (Mish) talking on a Howe Street podcast about Greece and the Eurozone and the possibility of a default.
http://talkdigitalnetwork.com/2015/02/greece-should-leave-eurozone/
and the fact that Greece is running a primary account surplus now.
http://www.wsj.com/articles/greece-expects-primary-budget-surplus-for-2015-1416567297
Well said Mish about how unreasonable it is for Greece to be required to suffer for decades to pay back these debts. Who else is paying back their debts?
This is similar to Germany’s World War I reparations debts iin the 1920s and we all know how that ended politically. Germany’s WWI reparations payments would have lasted into the 1980s if my reading is correct. Financially, I think Germany never paid back the vast majority of its reparations debts, which were eventually forgiven but it was too late to prevent a certain individual from taking power with all the dire consequences that caused in the 1930s and 1940s.
Also, Greece is nor a belligerent nation – these are just the debts for disastrous socialist policies and Mish is correct about the credits – they should take losses more making stupid loans.
It’s fascinating because Greece is one of very few Western countries that is running any kind of surplus I would bet.
This is completely contrary to the currently accepted Keynesian interventionist economic theories worldwide, where a nation would run a deficit in a recession to support the economy and a surplus in a boom when there is more tax revenue. However, Greece is being made to run a primary surplus in the teeth of a real economic depression with 30% unemployed (a similar level to the unemployment in Germany in 1931).
However, I don’t hear Paul Krugman the ultimate post-modern Keynesian criticizing this situation that is being imposed upon Greece. He should be screaming from the rooftops that this is totally against the economic theories that he worships!
Friday, 20 February 2015
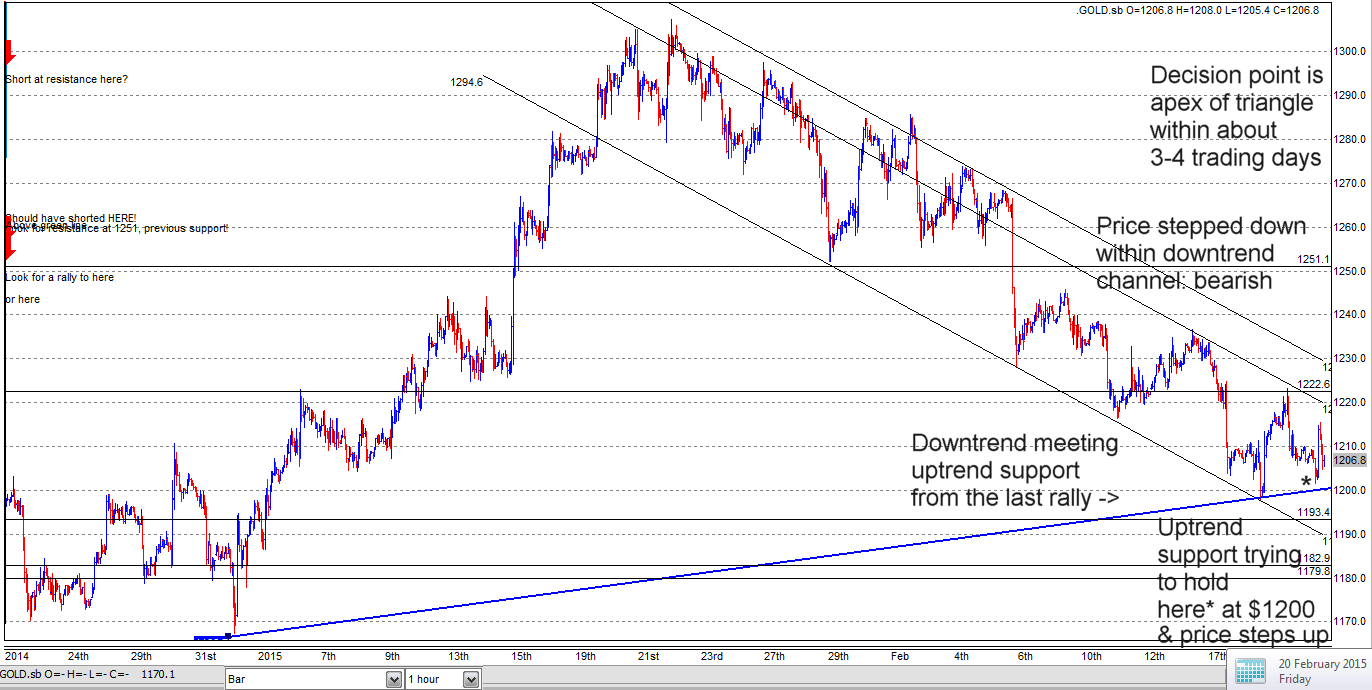
Gold is slipping on the edge of the cliff on Friday 20 February 2015 19:17 GMT
Gold is slipping on the edge of the cliff on Friday 20 February 2015 at 19:17 GMT. The uptrend support line is being broken as I write, this very moment.
Subscribe to:
Posts (Atom)