My charts as of last week:
Target for Pound $1.11, gold $1170 or $1100, gold might still be near £1000/oz.
Once $1250 region is breached, $1170 and $100 come into play at the lower ines of the Andrews pitchforks:
As for you Britush pound, $.11 target would just need a duplicate of the Brexit fall in a typical Trident Trading ABCD pattern (not marked):
1st move $1.48 to 1.30, next move 1.29 to 1.11. It could be worse. It could be taken from 1.50 to 1.28 then 1.29 to 1.07:
Monday, 10 October 2016
Target for Pound $1.11, gold $1170 or $1100, gold might still be near £1000/oz.
My charts as of last week:
Target for Pound $1.11, gold $1170 or $1100, gold might still be near £1000/oz.
Once $1250 region is breached, $1170 and $100 come into play at the lower ines of the Andrews pitchforks:
As for you Britush pound, $.11 target would just need a duplicate of the Brexit fall in a typical Trident Trading ABCD pattern (not marked):
1st move $1.48 to 1.30, next move 1.29 to 1.11. It could be worse. It could be taken from 1.50 to 1.28 then 1.29 to 1.07:
Target for Pound $1.11, gold $1170 or $1100, gold might still be near £1000/oz.
Once $1250 region is breached, $1170 and $100 come into play at the lower ines of the Andrews pitchforks:
As for you Britush pound, $.11 target would just need a duplicate of the Brexit fall in a typical Trident Trading ABCD pattern (not marked):
1st move $1.48 to 1.30, next move 1.29 to 1.11. It could be worse. It could be taken from 1.50 to 1.28 then 1.29 to 1.07:
20 months EMA on gold being tested - Twins?
Looking at the monthly gold chart posted by FullGold crown on goldtadise, the 20 months EMA on gold is being tested. Do we have twins? For bears there probably needs to be a little end run around this average before the plunge. For bulls, the 20EMA had better hold.
Thursday, 25 August 2016
Wednesday, 6 July 2016
Gold price in GBP sterling has retraced 61.8% of its losses and more.
I just posted this on www.goldtadise.com in reply to Mark's post.
Mark was looking at gold's move to $1369 and saying that in USD that is very close to a 38.2% retracement of the entire downmove from $1900+ to $1045 and possibly a point for resistance. I replied:
Actually I have taken a closer look and it is very close to 61.8% in sterling. Close enough still to be resistance. Also, today's sterling price (£1057) has just broken above the upper end of the support zone during the market topping process (2011-2013) which was from about 960 to 1015 BP. Last week's close price was about 1013 but today's is 1057 GBP. I don't know why the $GOLD:$GBPUSD chart is not giving me any of this week's prices but there you go! Here is the chart:
Mark was looking at gold's move to $1369 and saying that in USD that is very close to a 38.2% retracement of the entire downmove from $1900+ to $1045 and possibly a point for resistance. I replied:
It is now $1368.70 / $1369.70 Bid/Ask on Kitco, right where your lines meet (1369.90).
High so far today was $1371.90, low $1364.00 (6 July 2016 10,00 BST UK time).
I guess you are looking at the 38.2% retracement of the entire downmove from $1920 to $1045 approx coming in around $1369, approx.
I am looking at gold in GBP and I can tell you that the retracement of the downmove is now more than 61.8% in sterling. Not that it is the most important price but it is interesting to note.
Actually I have taken a closer look and it is very close to 61.8% in sterling. Close enough still to be resistance. Also, today's sterling price (£1057) has just broken above the upper end of the support zone during the market topping process (2011-2013) which was from about 960 to 1015 BP. Last week's close price was about 1013 but today's is 1057 GBP. I don't know why the $GOLD:$GBPUSD chart is not giving me any of this week's prices but there you go! Here is the chart:
Wednesday, 15 June 2016
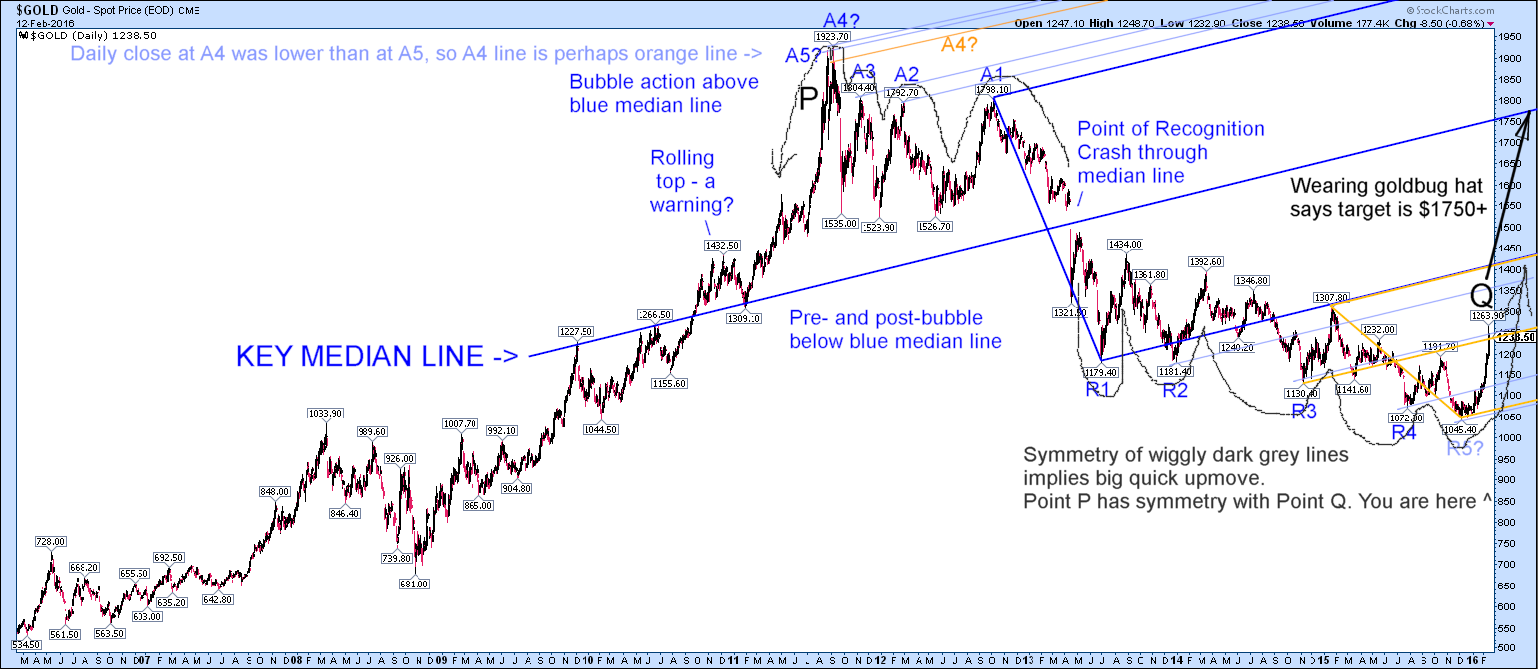
Gold's bull market pitchfork there all along.
Gold has been tracing out a bull market pitchfork structure that began in early 2011 at the $1309 low. Strange that $1309 was the level at which the price was rejected from re-entering that very same structure early in 2015 and stranger that so many are looking at $1309 yet again under the name of the "Matterhorn" - the goal to reach in the first leg of a potential new bull market.
Sure, $1309 is a crucial horizontal resistance/support level going back to early 2011 at least. However, my chart tells me that $1400 is going to be the key. A move over $1400 is now needed to get gold back into this bullish pitchfork structure. Since it is an up-sloping channel, as time goes on, this target creeps gradually higher and will soon get to $1430 another key level of resistance in late 2010 and Summer 2013 - green line on second chart.
Strangely, or not so strangely, the recent bullish action in gold has followed a half width parallel pitchfork (show in orange) parallel to and just underneath the larger structure. Possibly that is encouraging, since it means that the slope of the larger structure is still in force or has re-asserted itself as a determinant of price action.
The median line of this structure is at $1750 so a move above $1400 or so back into the blue pitchfork would suggest a potential quick move to $1750:
The action-reaction lines and the symmetry of the trading pattern would suggest a quick move to $1400 after a hesitation near $1300 and then a pullback before another quick move to $1750. The final target would be $2100 at the top of the fork but let's not get ahead of ourselves:
Sure, $1309 is a crucial horizontal resistance/support level going back to early 2011 at least. However, my chart tells me that $1400 is going to be the key. A move over $1400 is now needed to get gold back into this bullish pitchfork structure. Since it is an up-sloping channel, as time goes on, this target creeps gradually higher and will soon get to $1430 another key level of resistance in late 2010 and Summer 2013 - green line on second chart.
Strangely, or not so strangely, the recent bullish action in gold has followed a half width parallel pitchfork (show in orange) parallel to and just underneath the larger structure. Possibly that is encouraging, since it means that the slope of the larger structure is still in force or has re-asserted itself as a determinant of price action.
The median line of this structure is at $1750 so a move above $1400 or so back into the blue pitchfork would suggest a potential quick move to $1750:
The action-reaction lines and the symmetry of the trading pattern would suggest a quick move to $1400 after a hesitation near $1300 and then a pullback before another quick move to $1750. The final target would be $2100 at the top of the fork but let's not get ahead of ourselves:
Sunday, 1 May 2016
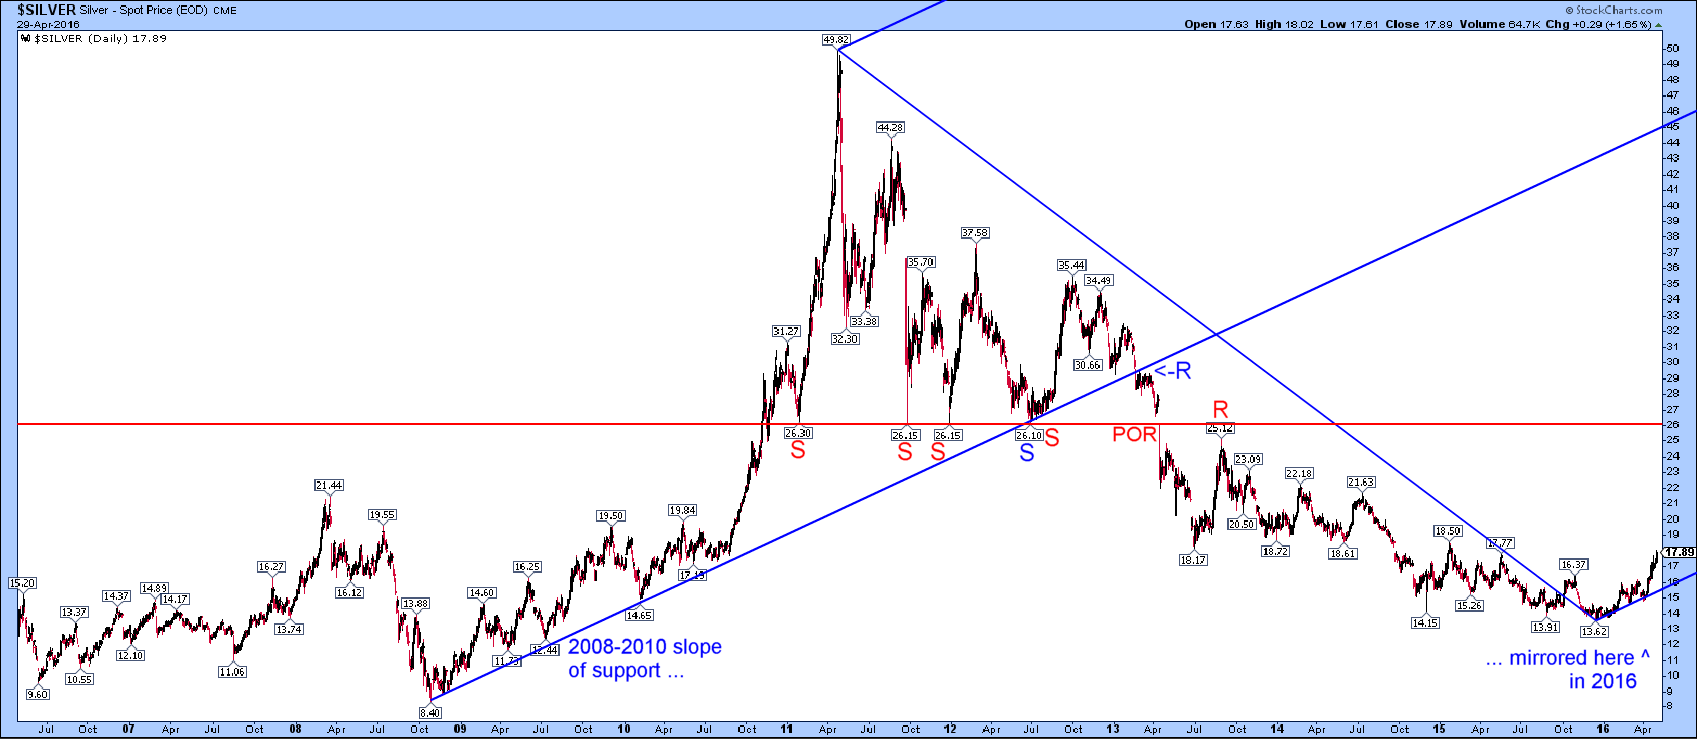
Silver's outrageous bull market pitchfork (and comparison with gold's).
OK, this one is for silverbugs:
Here is my outrageous pitchfork that stamps a bull market on silver that never ended, despite the 70% correction. Just for fun! Silver can go just below $16 again and not negate the pattern. Note the price support action since the December 2015 low has the same slope as all the price support between October 2008 and September 2010 before the bubble phase began:
The median line of this pitchfork has so many hits that it looks very good to me. Also the price top at $50 absolutely mandates the position of the lower line that has just been hit by the December 2013 lows. It could have hit a bit sooner or a bit later. Even so, this is not quite the same as my bullish gold fork. In the silver one the $26 level is key as is the reversal from support to resistance along the blue median line. The bear market Point Of Recognition started at the $26 level of horizontal support but was triggered by the move below around $30 on the blue line in early 2013.
With gold, the median line goes straight through the POR; not quite the as for silver I don't care. These look good to me; good enough for now anyway. Symmetry of the action and reaction lines on the gold chart also adds to the juice:
Subscribe to:
Posts (Atom)