Well I was discussing this with a friend and we concluded where is the US dollar bear market and the downturn that so many are looking for? Nowhere right now. Three charts. Massive breakout for massive falling wedge has occurred. It's going to take a lot to reverse this dollar bull run.
Wednesday, 6 September 2023
US Dollar index looks to be in bullish uptrend.
Well I was discussing this with a friend and we concluded where is the US dollar bear market and the downturn that so many are looking for? Nowhere right now. Three charts. Massive breakout for massive falling wedge has occurred. It's going to take a lot to reverse this dollar bull run.
Monday, 27 July 2020
Nasdaq crash clinton blair speeches march 2000
Nasdaq crash Clinton Blair speeches 14th March 2000:
The coincidence and/or causality that the Blair and Clinton speeches on biotechnology and the human genome intellectual property issue as of 14 March 2000 and the Nasdaq crash that started the very next day:
Also see here:
https://clintonwhitehouse4.archives.gov/textonly/WH/New/html/20000315_2.html and here https://science.sciencemag.org/content/287/5460/1903.1 for commentary but no need to sign on there because the text is on the first link and is repeated at the bottom of this post.
Well, what happened on the 15th of March 2000?
"JOINT STATEMENT BY PRESIDENT CLINTON
AND PRIME MINISTER TONY BLAIR OF THE U.K.
In the last decade of the twentieth century, scientists from around the world initiated one of the most significant scientific projects of all time: to determine the DNA sequence of the entire human genome, the human genetic blueprint. Progressing ahead of schedule, human genome research is rapidly advancing our understanding of the causes of human disease and will serve as the foundation for development of a new generation of effective treatments, preventions, and cures.
To realize the full promise of this research, raw fundamental data on the human genome, including the human DNA sequence and its variations, should be made freely available to scientists everywhere. Unencumbered access to this information will promote discoveries that will reduce the burden of disease, improve health around the world, and enhance the quality of life for all humankind. Intellectual property protection for gene-based inventions will also play an important role in stimulating the development of important new health care products.
We applaud the decision by scientists working on the Human Genome Project to release raw fundamental information about the human DNA sequence and its variants rapidly into the public domain, and we commend other scientists around the world to adopt this policy. "
The coincidence and/or causality that the Blair and Clinton speeches on biotechnology and the human genome intellectual property issue as of 14 March 2000 and the Nasdaq crash that started the very next day:
Also see here:
https://clintonwhitehouse4.archives.gov/textonly/WH/New/html/20000315_2.html and here https://science.sciencemag.org/content/287/5460/1903.1 for commentary but no need to sign on there because the text is on the first link and is repeated at the bottom of this post.
Well, what happened on the 15th of March 2000?
"JOINT STATEMENT BY PRESIDENT CLINTON
To realize the full promise of this research, raw fundamental data on the human genome, including the human DNA sequence and its variations, should be made freely available to scientists everywhere. Unencumbered access to this information will promote discoveries that will reduce the burden of disease, improve health around the world, and enhance the quality of life for all humankind. Intellectual property protection for gene-based inventions will also play an important role in stimulating the development of important new health care products.
We applaud the decision by scientists working on the Human Genome Project to release raw fundamental information about the human DNA sequence and its variants rapidly into the public domain, and we commend other scientists around the world to adopt this policy. "
Thursday, 23 July 2020
Gold action now inside the huge pitchfork and guess what? $1900 almost here.
Here: http://1000gold.blogspot.com/2020/06/enormous-pitchfork-in-gold-in-play.html
I proposed that the move above $1780 could mean a slingshot move in gold. It happened. Now gold spot price flirted with $900 today. This chart was as of Wednesday:
Tuesday, 23 June 2020
Enormous pitchfork in gold in play again now after 8 years.
This was hand drawn owing to lack of suitable software for drawing pitchforks but the point is clear! Enormous move in gold is possible from here on, to $2100 or more to get to the median line of the old pitchfork that encompasses trading right back to the pre-insane days near the end of the 1999-2011 bull market. Alternatively, gold fails here at this $1760-1800 level and that could be the end of the bull for quite some time. The multiple pushing upwards against this line hints at a real battle between buyers and sellers going on here and constant buying pressure. If it breaks above, those sellers will probably become buyers and the up move could be very quick indeed.
Friday, 21 February 2020
Coronavirus forecast charts COVID-19.
I have some data analysis and forecasting for the outbreak of 2009 novel Coronavirus, n-Cov, now re-named COVID-19.
The charts are self explanatory, all copyright David Bellamy 2020 and may not be re-published without permission.
Forecast for world cases under current conditions (see legend). This effectively amounts to world cases under the assumption that the epidemic is confined to China and principally Wuhan and Hubei Province.
Forecast for world cases under current conditions (see legend). This effectively amounts to world deaths under the assumption that the epidemic is confined to China and principally Wuhan and Hubei Province.
However, Daily % New Deaths are higher than daily % New Cases:
Much more data and analysis to come.
The charts are self explanatory, all copyright David Bellamy 2020 and may not be re-published without permission.
Forecast for world cases under current conditions (see legend). This effectively amounts to world cases under the assumption that the epidemic is confined to China and principally Wuhan and Hubei Province.
Forecast for world cases under current conditions (see legend). This effectively amounts to world deaths under the assumption that the epidemic is confined to China and principally Wuhan and Hubei Province.
However, Daily % New Deaths are higher than daily % New Cases:
Much more data and analysis to come.
Wednesday, 17 July 2019
Silver to break to the upside soon?
Watching the trading over the past few days, silver has been outperforming gold. Yesterday (Tues 16 July) in particular, gold was flat to down, whist silver was up around 35 cents. The 3-day charts on www.kitco.com clearly showed the trading for silver was stepping higher over the past three days whilst gold was within a tight trading range.
Now, today, there are up-moves in both metals, gold +1.26%, silver +2.58% about a 2x out-performance on the upside move.
There has therefore been a down-move in the gold:silver ratio from its extreme levels of late around 95:1. A gap in fact. Will this gap be "filled" as many like to predict in these instances? Is a gap in a ratio like this as valid as a gap on the open in a stock and how about in commodities like these where there is nearly 24 hour trading - although I guess stock futures trade out of hours too? I cannot tell.
Now, today, there are up-moves in both metals, gold +1.26%, silver +2.58% about a 2x out-performance on the upside move.
There has therefore been a down-move in the gold:silver ratio from its extreme levels of late around 95:1. A gap in fact. Will this gap be "filled" as many like to predict in these instances? Is a gap in a ratio like this as valid as a gap on the open in a stock and how about in commodities like these where there is nearly 24 hour trading - although I guess stock futures trade out of hours too? I cannot tell.
Tuesday, 25 June 2019
Gold green in all currencies often.
It's always nice to look at Kitco's gold in currencies table and see all green.
Bitcoin is strategically placed just underneath this table to make goldbugs envious:
Saturday, 22 June 2019
Gold in Euros touches 2016 high @ €1245.
Gold in Euros this week has touched the 2016 at €1245.
I now see that I had not been watching this chart for some time - I just went to look and there it is. Coincidental with $1400 gold.
Gold breaks out from long term resistance levels - at last!
After giving very little to write about for several months, gold has made a most unusual move for the period around the start of summer.
The rarity of this move should not be lost on market watchers or participants because the period May to August is usually the time that the gold price wallows or even slumps into a lower trading range. However this is the time that the market has chosen to break out decisively from a 5+ year trading range.
Almost undoubtedly, the announcements from the Federal Reserve regarding the potential of interest rate cuts and at least the ceasing of interest rate rises for the time being have played into this, although a rally was already underway. Geopolitical factors such as the Iran/US conflict brewing in the Straits of Hormuz have also played a part.
The two charts below show the various resistance lines in play in gold priced in US dollars and GB Pounds Sterling.
Red line = resistance from 2016 bull market high at $1377
Green Line = Resistance from 2014 high external peak at $1392
Blue line =Resistance from 2013 rally after the crash at $1434
Black lines = resistance zone from the topping pattern in 2011-2012 above $1520:
In British Pounds, he chart is more perky.The resistance zone at £960-£1005 has already been cleared. In fact, all of the trading since the gold price jump on the Brexit vote on 23 June 2016 has been around that very zone. The peaks from the bear market region (where the price dipped as low as £693) have long been taken out and left behind as gold has been trading around £1000 for three years:
Taking a look at a 20 year chart, I have marked some times when decent up-moves have occurred in gold priced in US dollars.
The only times when decent rallies have occurred in the summer were 2000, a bounce in 2008, (2011, 2012 and 2013 rallies were later in summer), and 2016. There has been little positive early summer action in gold during the entire bull and bear market cycle since 1999. This illustrates the "outside the norm" nature of this current move:
Tuesday, 30 October 2018
Gold at back-test of pitchfork failure line in USD and also at resistance in GBP.
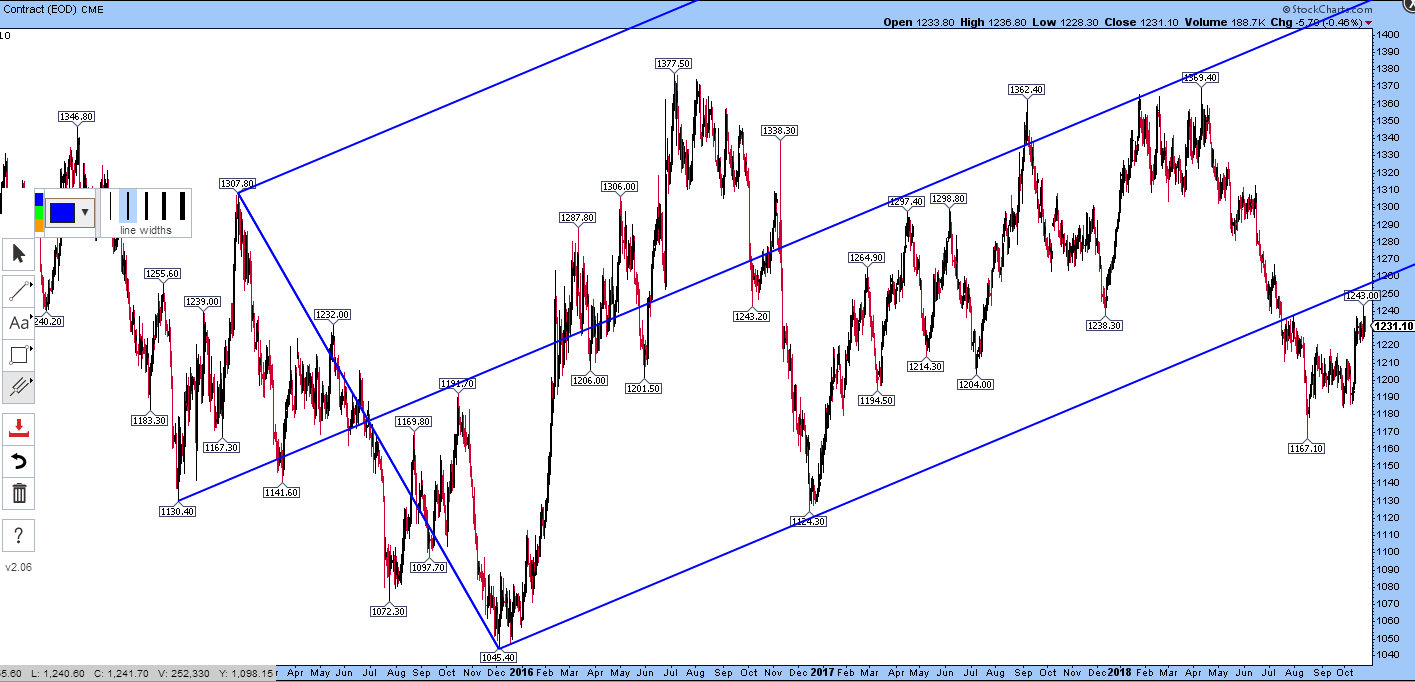
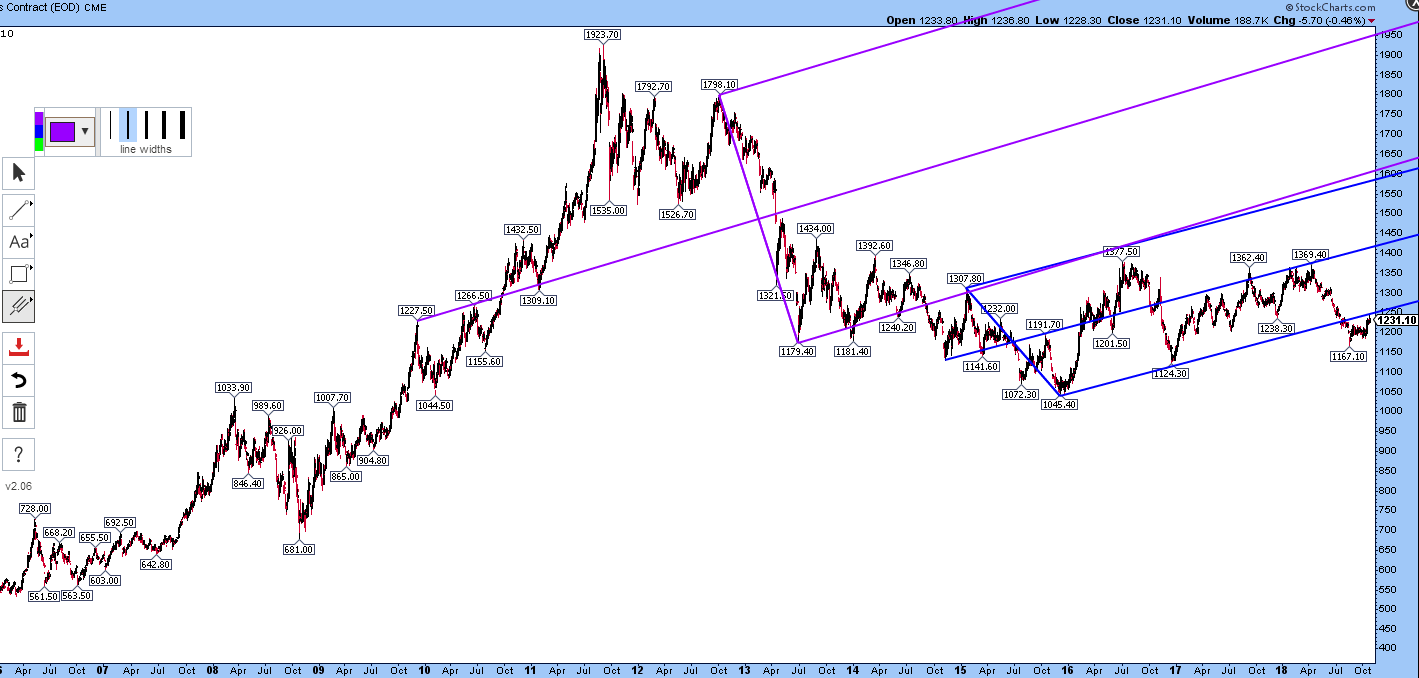
Gold is very close to its back-test of pitchfork failure line from a pattern in force since 2015. Maybe it already happened. Maybe a push to around $1250 would complete it:

It's always difficult to nail these patterns exactly, since it depends if you take daily or weekly charts and if you take intraday or closing prices as the pivot points.
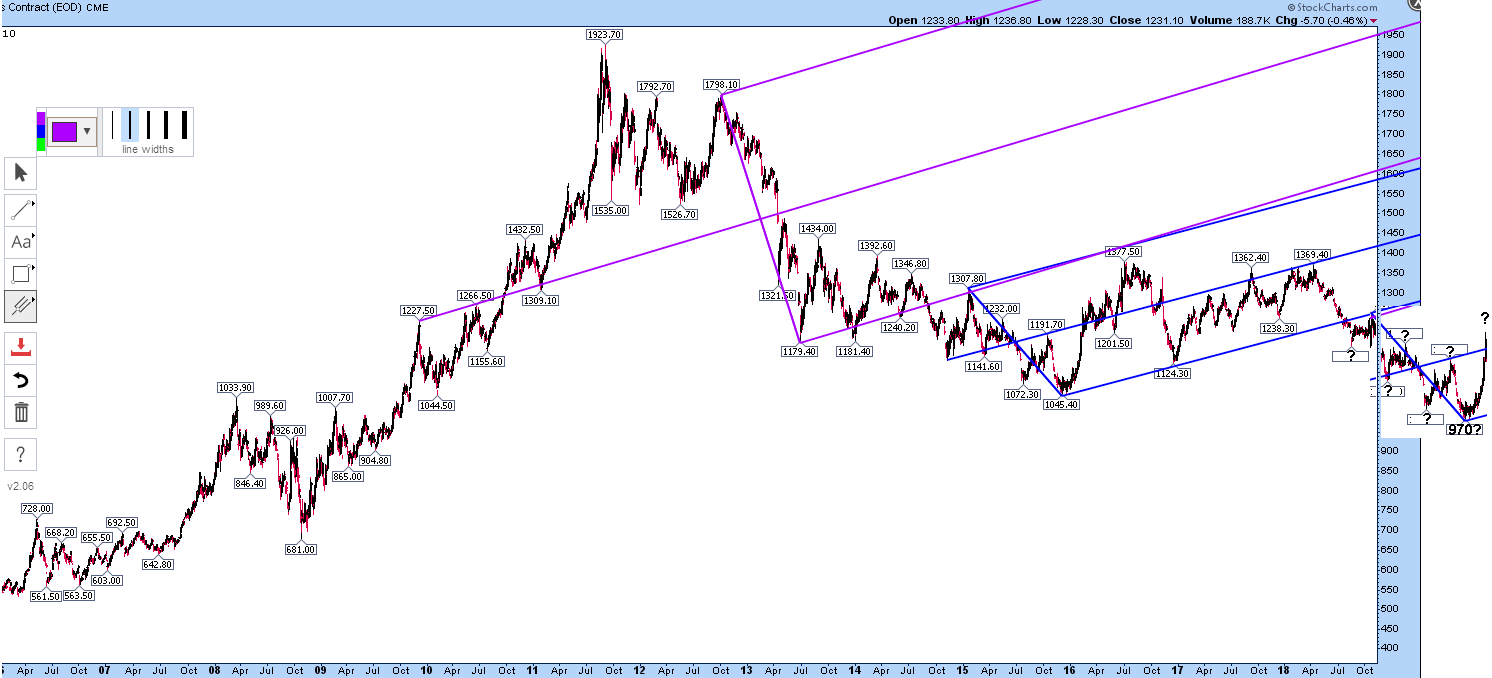
The weekly chart says the high might already be in:

A little mischief with the above chart might suggest a $970-980 target:

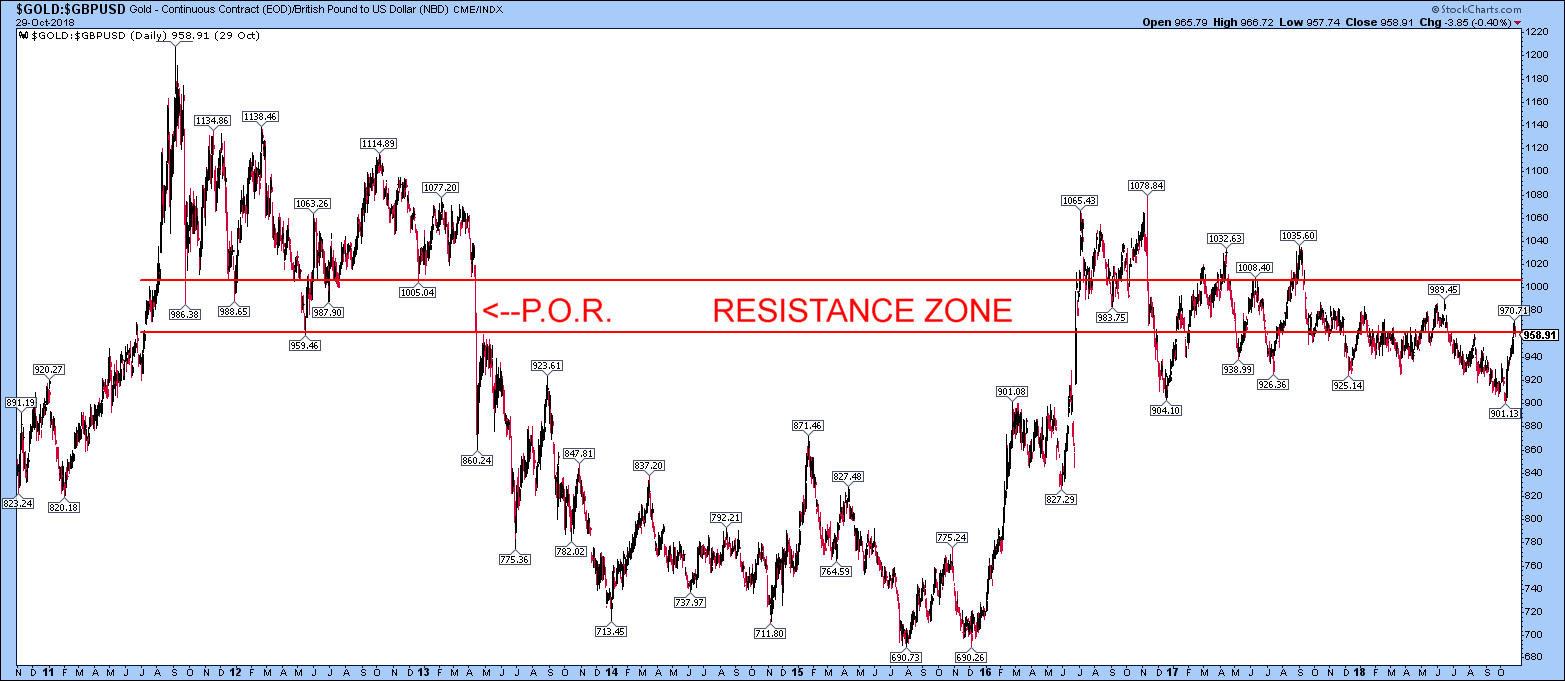
Meanwhile, back at the ranch, gold in GBP (pounds) has just nudged to or into the resistance zone above 960; another back-test perhaps? Coincidence?

It's always difficult to nail these patterns exactly, since it depends if you take daily or weekly charts and if you take intraday or closing prices as the pivot points.
The weekly chart says the high might already be in:

A little mischief with the above chart might suggest a $970-980 target:

Meanwhile, back at the ranch, gold in GBP (pounds) has just nudged to or into the resistance zone above 960; another back-test perhaps? Coincidence?
Saturday, 18 August 2018
Gold broken down from long term bullish structure since 2010/2011
Gold has broken down from long term bullish structure since 2010/2011.
It looks bad. It looks awful, in fact. The 2016 bull market run could be over according to this - or very nearly.
Targets $1085 or $920 to downside on longer term lower chart.
$1085 is very near $1087 (50% retracement of entire bull market price run from $253 in 1999 to $1923 in 2011).
$920 is the level that comes from a channel doubling of the blue pitchfork, which makes geometric sense and would of course be a new bear market low.
Possibility of a rally to re-test (to back-test) the $1235 breakdown at the bottom of the fork but maybe it has been back-tested already on a smaller scale (upper chart). The gross oversold condition right now might indicate a technical rally. It would be interesting to see if any such rally could make it to $1235+.
The $1235 area was mentioned on an interesting YouTube video here from Alessio Rastani of leadingtrader.com (from Elliott Wave analysis)
It looks bad. It looks awful, in fact. The 2016 bull market run could be over according to this - or very nearly.
Targets $1085 or $920 to downside on longer term lower chart.
$1085 is very near $1087 (50% retracement of entire bull market price run from $253 in 1999 to $1923 in 2011).
$920 is the level that comes from a channel doubling of the blue pitchfork, which makes geometric sense and would of course be a new bear market low.
Possibility of a rally to re-test (to back-test) the $1235 breakdown at the bottom of the fork but maybe it has been back-tested already on a smaller scale (upper chart). The gross oversold condition right now might indicate a technical rally. It would be interesting to see if any such rally could make it to $1235+.
The $1235 area was mentioned on an interesting YouTube video here from Alessio Rastani of leadingtrader.com (from Elliott Wave analysis)
Crash in Gold... What Happens Now?
Saturday, 7 July 2018
Line in the sand for gold around $1230-1232 or maybe $1238-1240 (Charts).
For me, the line in the sand for this gold mini bull market (or bear market rally?) since December 2015 is around $1230-1232. If this is broken tot he downside, it looks like a much longer correction in the mini bull run. This pattern is 2.5 years old now, 30 months and so you might expect a good year's correction to go on if the uptrend is broken by a move below about $1230-1232.
Andrew's pitchfork giving $1232 as an allowable low but drawing these things can sometimes be not totally precise - and sometimes they are just a little off the trend channel that emerges, just a little, mind:
With a simple trend line, the situation is more tight, $1238 actually breaks the line by a tiny bit intraday:
Going between aily closes (thin red line below) gives the same result actually. $1238 was an intraday dip below the line. Now, where did it close?
The lowest close was around $1240, so gold has just got away with it so far. On the intraday (green line) or daily close level (blue line), the support from the lows last December has held - JUST!
It's hanging on by the skin of its teeth. really marginal here. Is someone looking for that classic pattern that has a false breakout whose name eludes me?
Andrew's pitchfork giving $1232 as an allowable low but drawing these things can sometimes be not totally precise - and sometimes they are just a little off the trend channel that emerges, just a little, mind:
With a simple trend line, the situation is more tight, $1238 actually breaks the line by a tiny bit intraday:
Going between aily closes (thin red line below) gives the same result actually. $1238 was an intraday dip below the line. Now, where did it close?
The lowest close was around $1240, so gold has just got away with it so far. On the intraday (green line) or daily close level (blue line), the support from the lows last December has held - JUST!
It's hanging on by the skin of its teeth. really marginal here. Is someone looking for that classic pattern that has a false breakout whose name eludes me?
The evergreen http://www.kitco.com site has this for today:
"Bid/Ask 1242.10 / 1243.10
Low/High 1235.80 / 1246.90"
Oops. The intraday support at $1238 was broken to $1235.80. Price has recovered to $1242.10 as of now.
Maybe Friday's close is going to tell the story or lead up the garden path if someone paints the charts below the lines inthe sand. However, if they CAN paint the charts, what does that say about the strength of the market?
Tuesday, 3 July 2018
Possible coins for sale English Crowns, Halfcrowns, etc.
I am posting here pictures of some potential coins for sale, since the pictures are quite large for sending by email.
Firstly 1927 George V Proof Set (6 silver coins), about FDC (Spink 2014 book price £700 in FDC but price negotiable).
Group pictures (scans) are first and some individual coins (photos) are shown below that:
Please click to enlarge:
I am posting here pictures of some potential coins for sale, since the pictures are quite large for sending by email.
Firstly 1927 George V Proof Set (6 silver coins), about FDC (Spink 2014 book price £700 in FDC but price negotiable).
Group pictures (scans) are first and some individual coins (photos) are shown below that:
Please click to enlarge:
1826 Penny Choice Uncirculated (4 pictures):
1845 Crown cinquefoil stops Choice GEF / AU
I would estimate an easy potential AU58 (4 pictures):
1820 Halfcrown Uncirculated (4 pictures):
1858 Penny about Unc (2 pictures):
1887 Crown toned Uncirculated (2 pictures):
1853 Sovereign WW relief NGC MS63 (2 pictures)
1871 Sovereign die#27 ANACS MS63 (5 pictures)
Subscribe to:
Posts (Atom)